Dashboard Hub Pro

Visualize, track & 

report anything DBH logo
with ease

Visualize, track & 

report anything DBH logo
with ease

Unlock powerful business insights with reporting built for teams – easily create and share dashboards with intuitive and custom metrics.

Unlock powerful business insights with reporting built for teams – easily create and share dashboards with intuitive and custom metrics.

Cloud fortified iconCloud fortified

Assessed for scale iconAssessed for scale

24 hour support icon24/5 support

Reliability checks iconReliability checks

Key benefits 01

Benefits icon

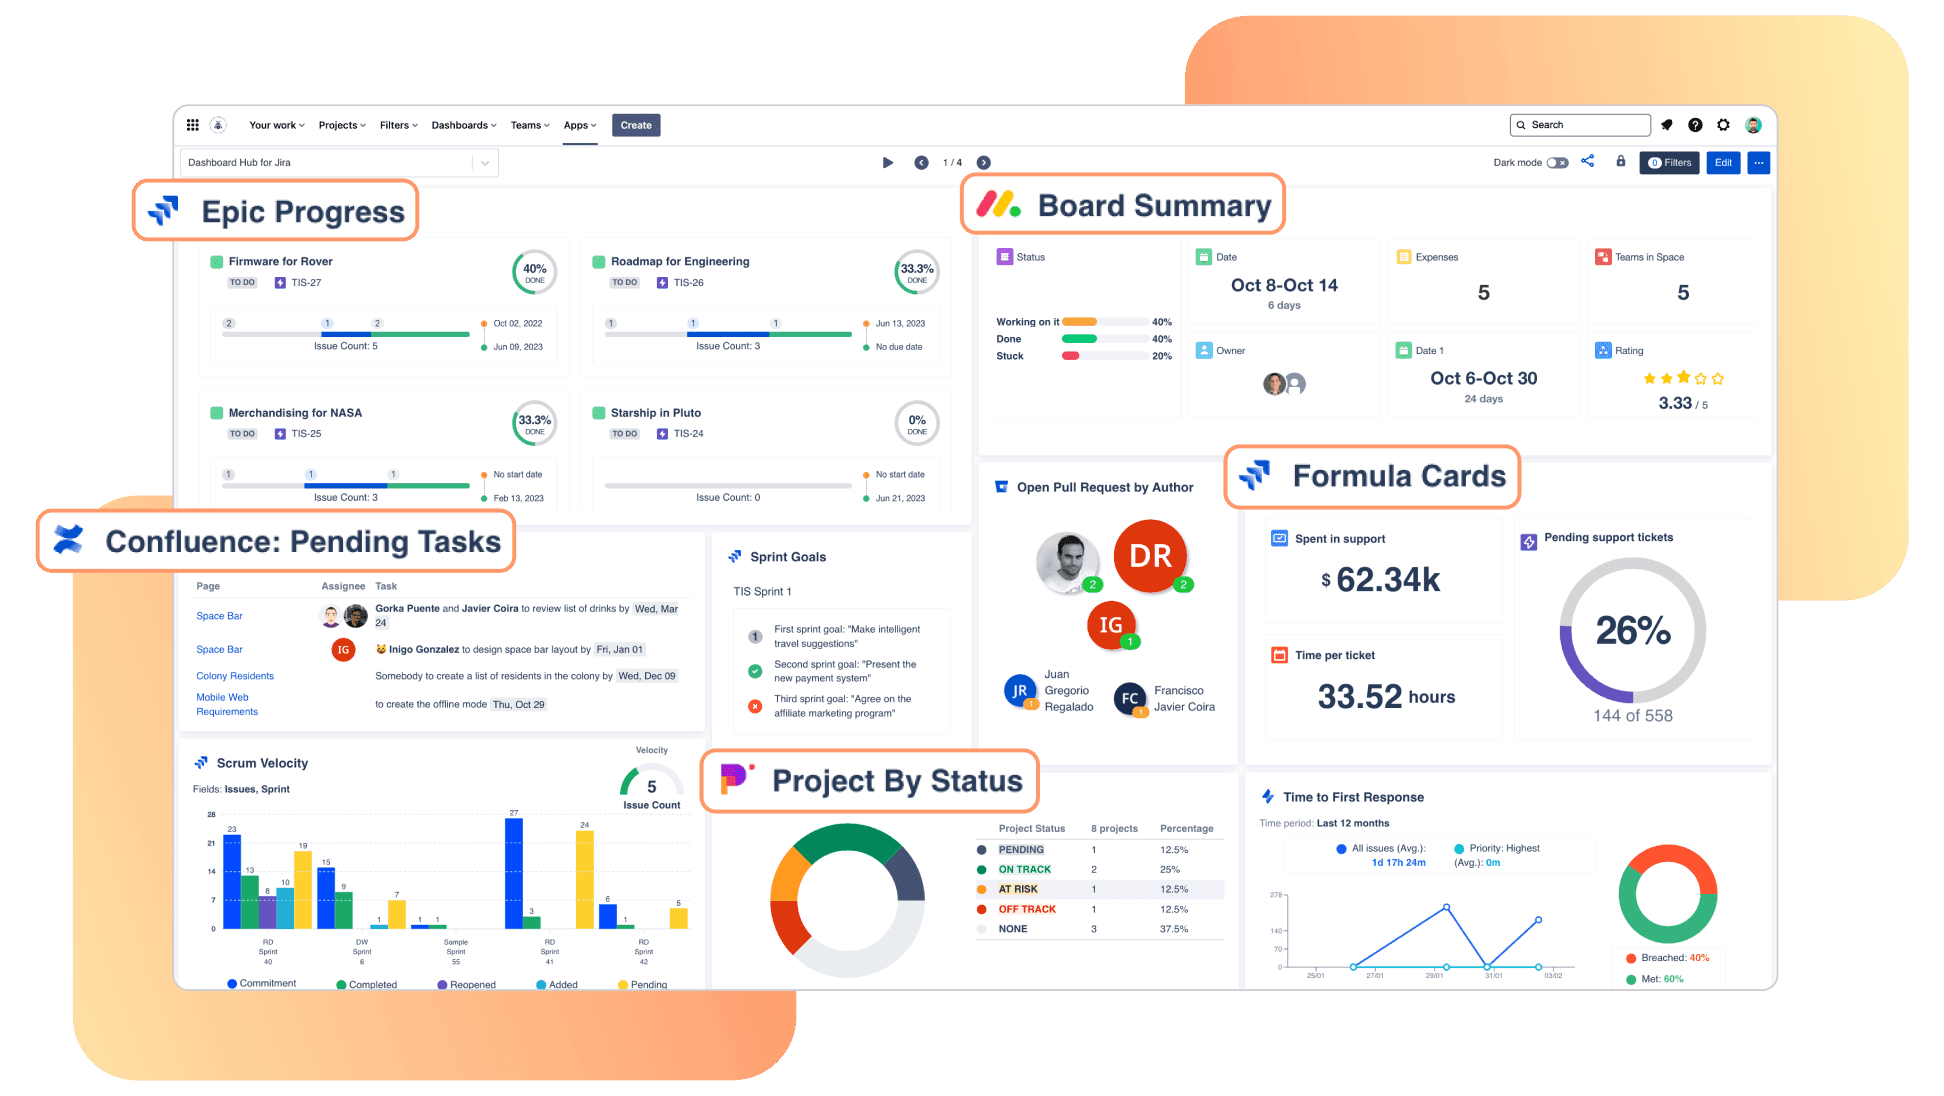
Limitless visualization

See the whole picture with effortless dashboards. Build them in minutes with customizable templates and charts.

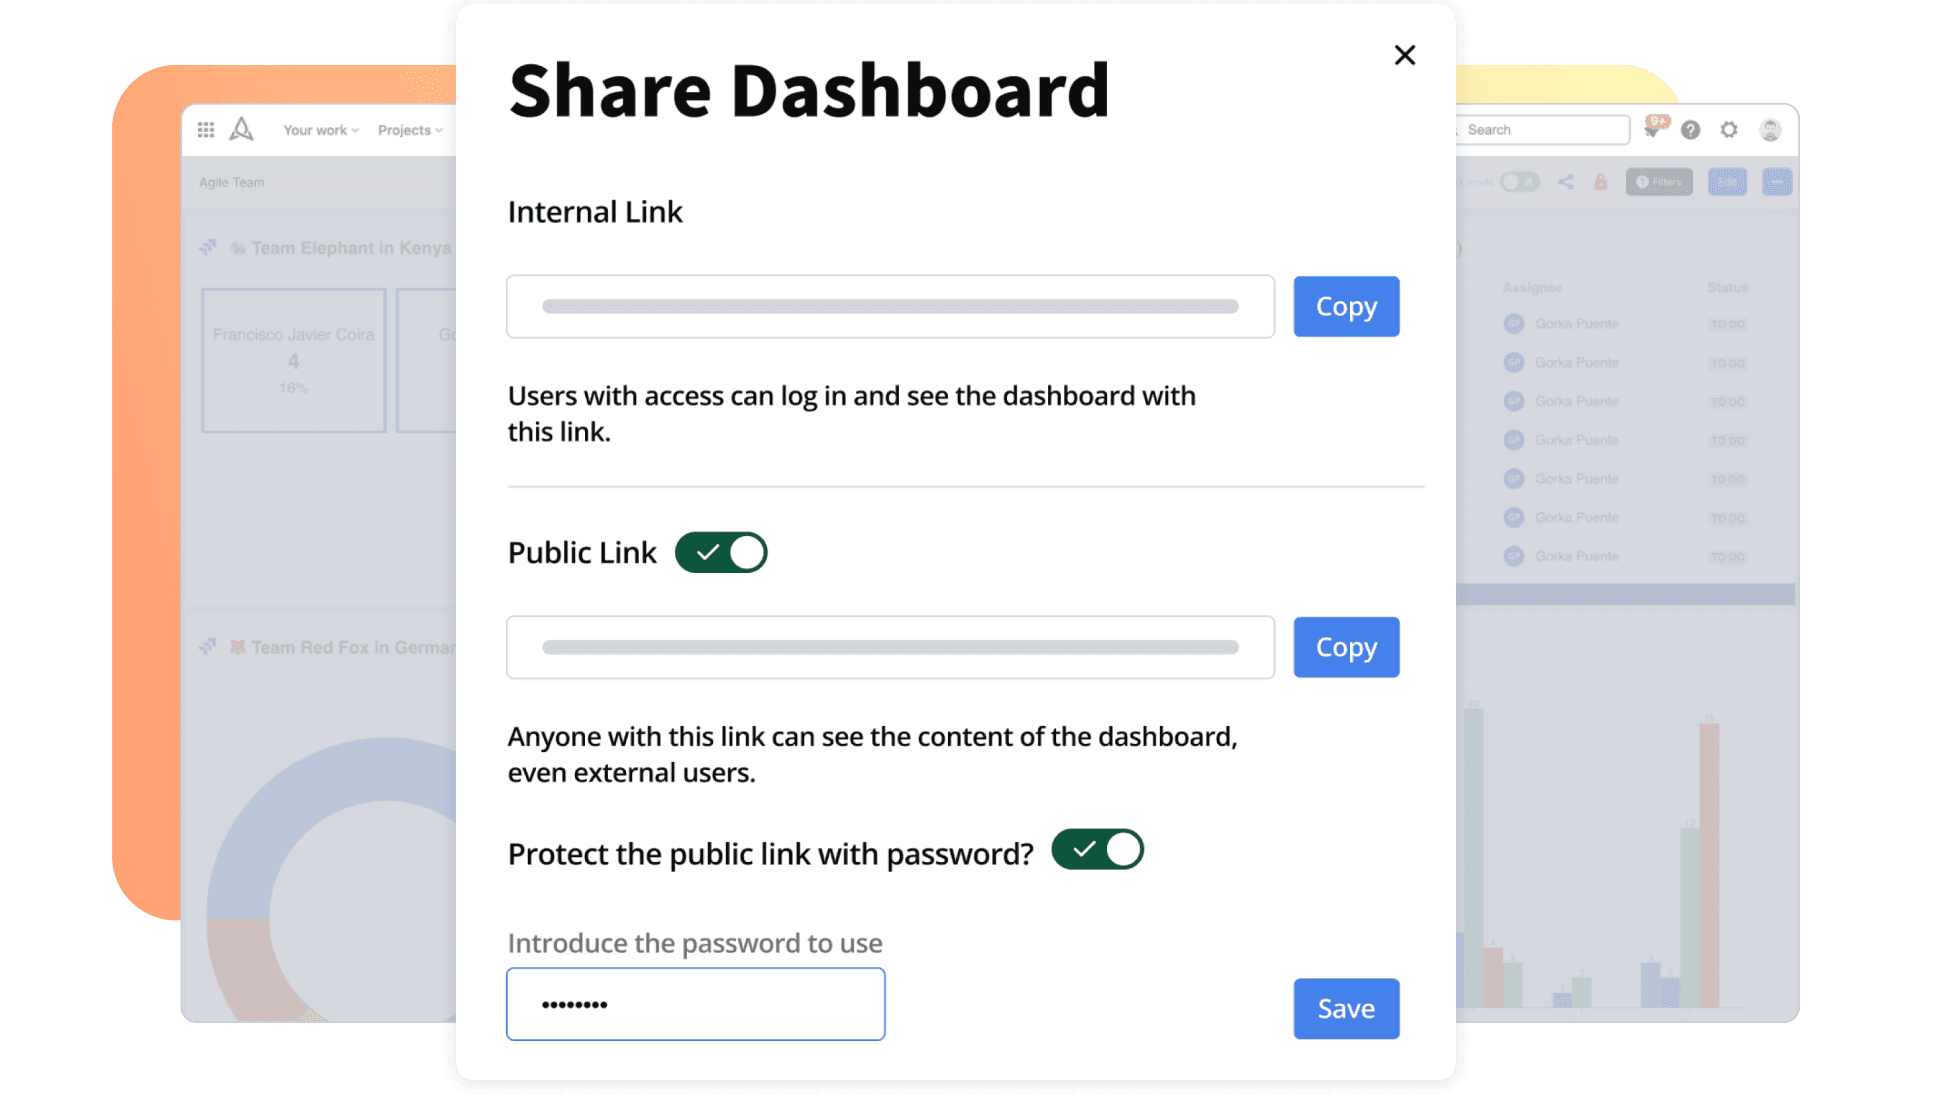
Share reports in seconds

Boost external transparency by easily sharing reports with just a few clicks.

All your data, centralized

Getting the whole team on the same page? It can happen. They’ll have one landing place with fewer tools to wrangle.

Customers 02

Teams who trust us

Key features 03

Enhance visualization. Simplify reporting.

Elevate your data game with centralized and highly sharable dashboards that turn data into actionable insights.

Pre-define dashboard templates & external share

Use templates to quickly set up powerful dashboards for ITSM, Agile, and DevOps teams. Share them with external stakeholders without access to your instance using secure links, or granting access from the Customer Portal
Pre-defined templates and external share

A central data hub for reporting

Create centralized dashboards that combine data from ~100 gadgets and 12+ integrations. Enable a single reference point where your teams can align and collaborate, avoiding context switching and jumping between tools
image

Powerful custom charts for reporting

Line charts, bar charts, pie charts, tile charts, or tables. Aggregations to calculate sums, min or max values, average, etc. Custom charts with JQL, Formulas, and calculations in JSM and Jira
image

Enterprise-ready

Unlimited Horizontal Scale, multi-instance (DC/Server data in Cloud dashboards), advanced permissions, and access restrictions.
image

More features

Insert chart icon

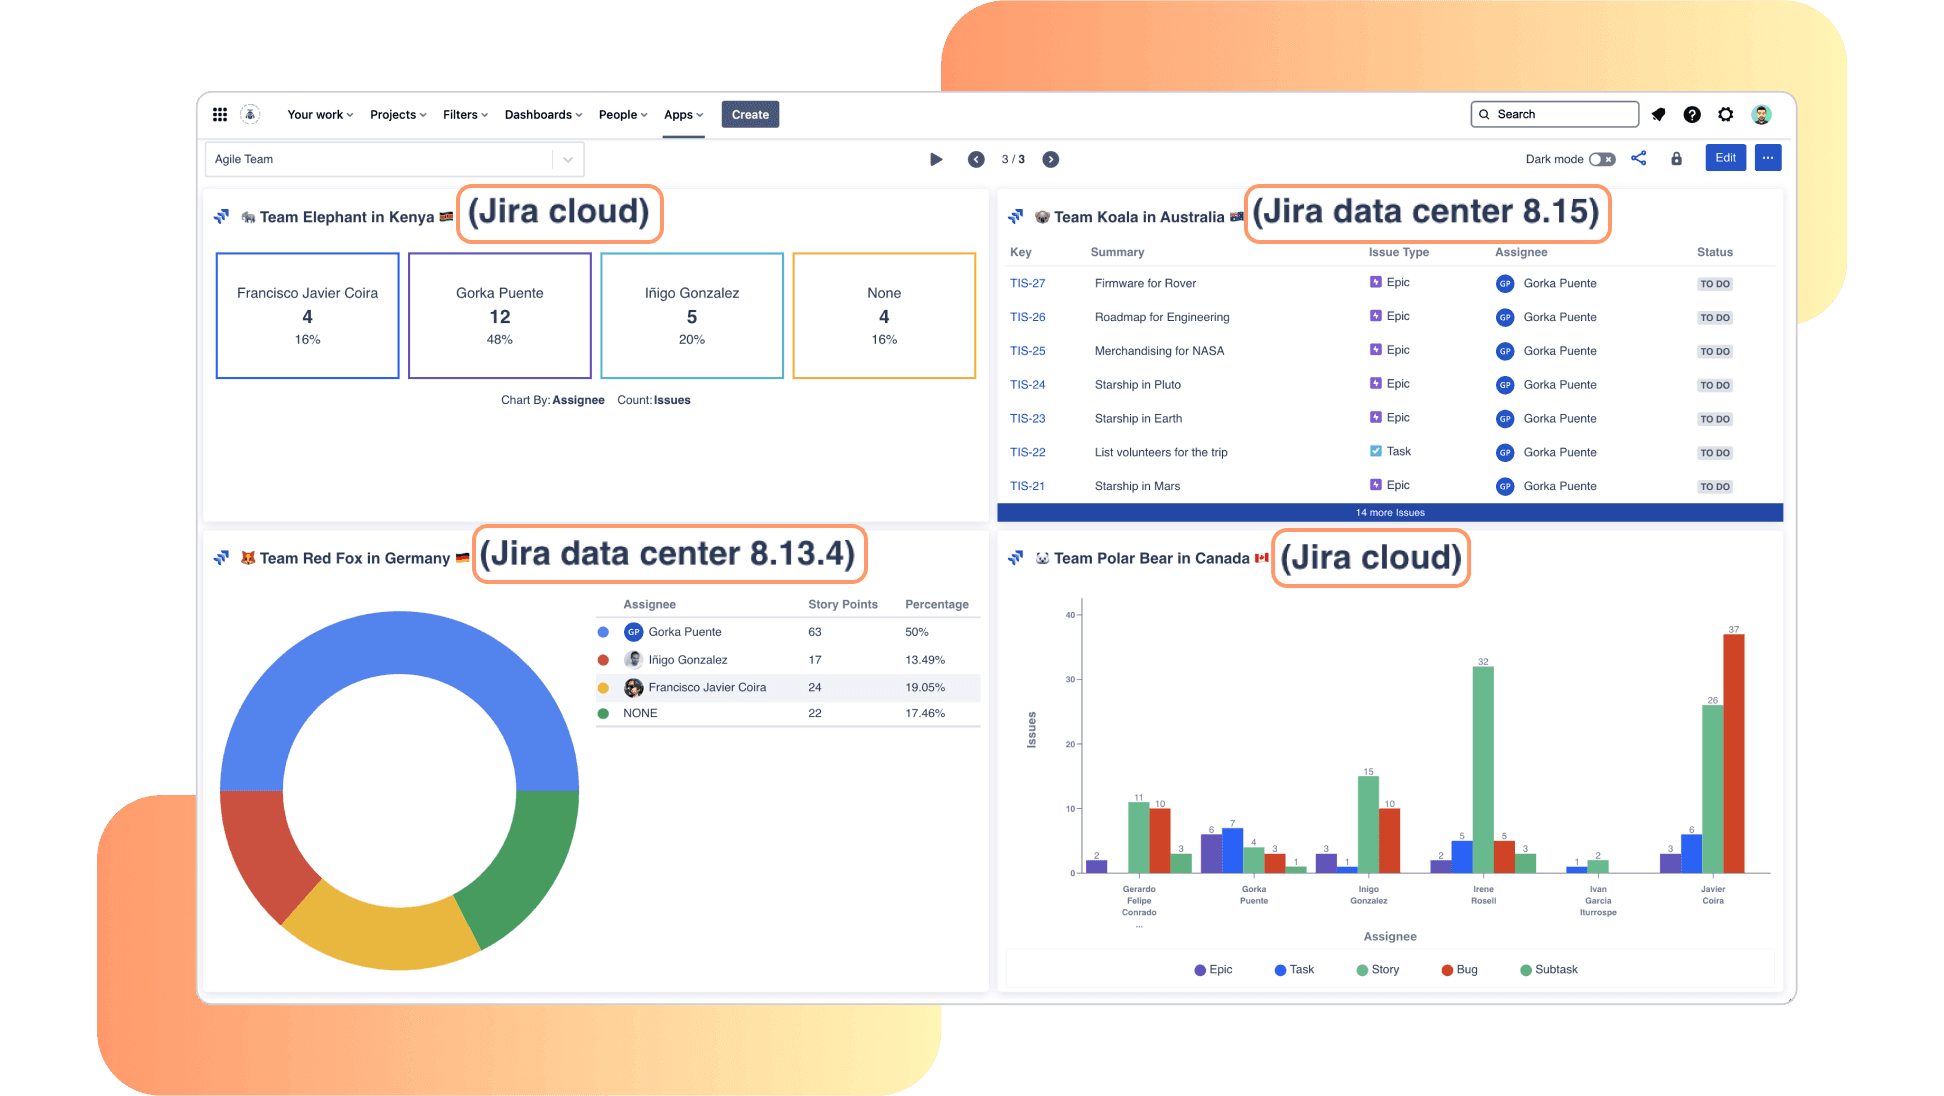
Portfolio-level reporting

Visualize multi-instance, multi-project, and cross team data in a single dashboard to consolidate data from all your projects and teams, at once.

Space dashboard icon

Enterprise-ready

Gain unlimited horizontal scalability, advanced permissions, and global access restrictions. Connect data from different instances in a single dashboard.
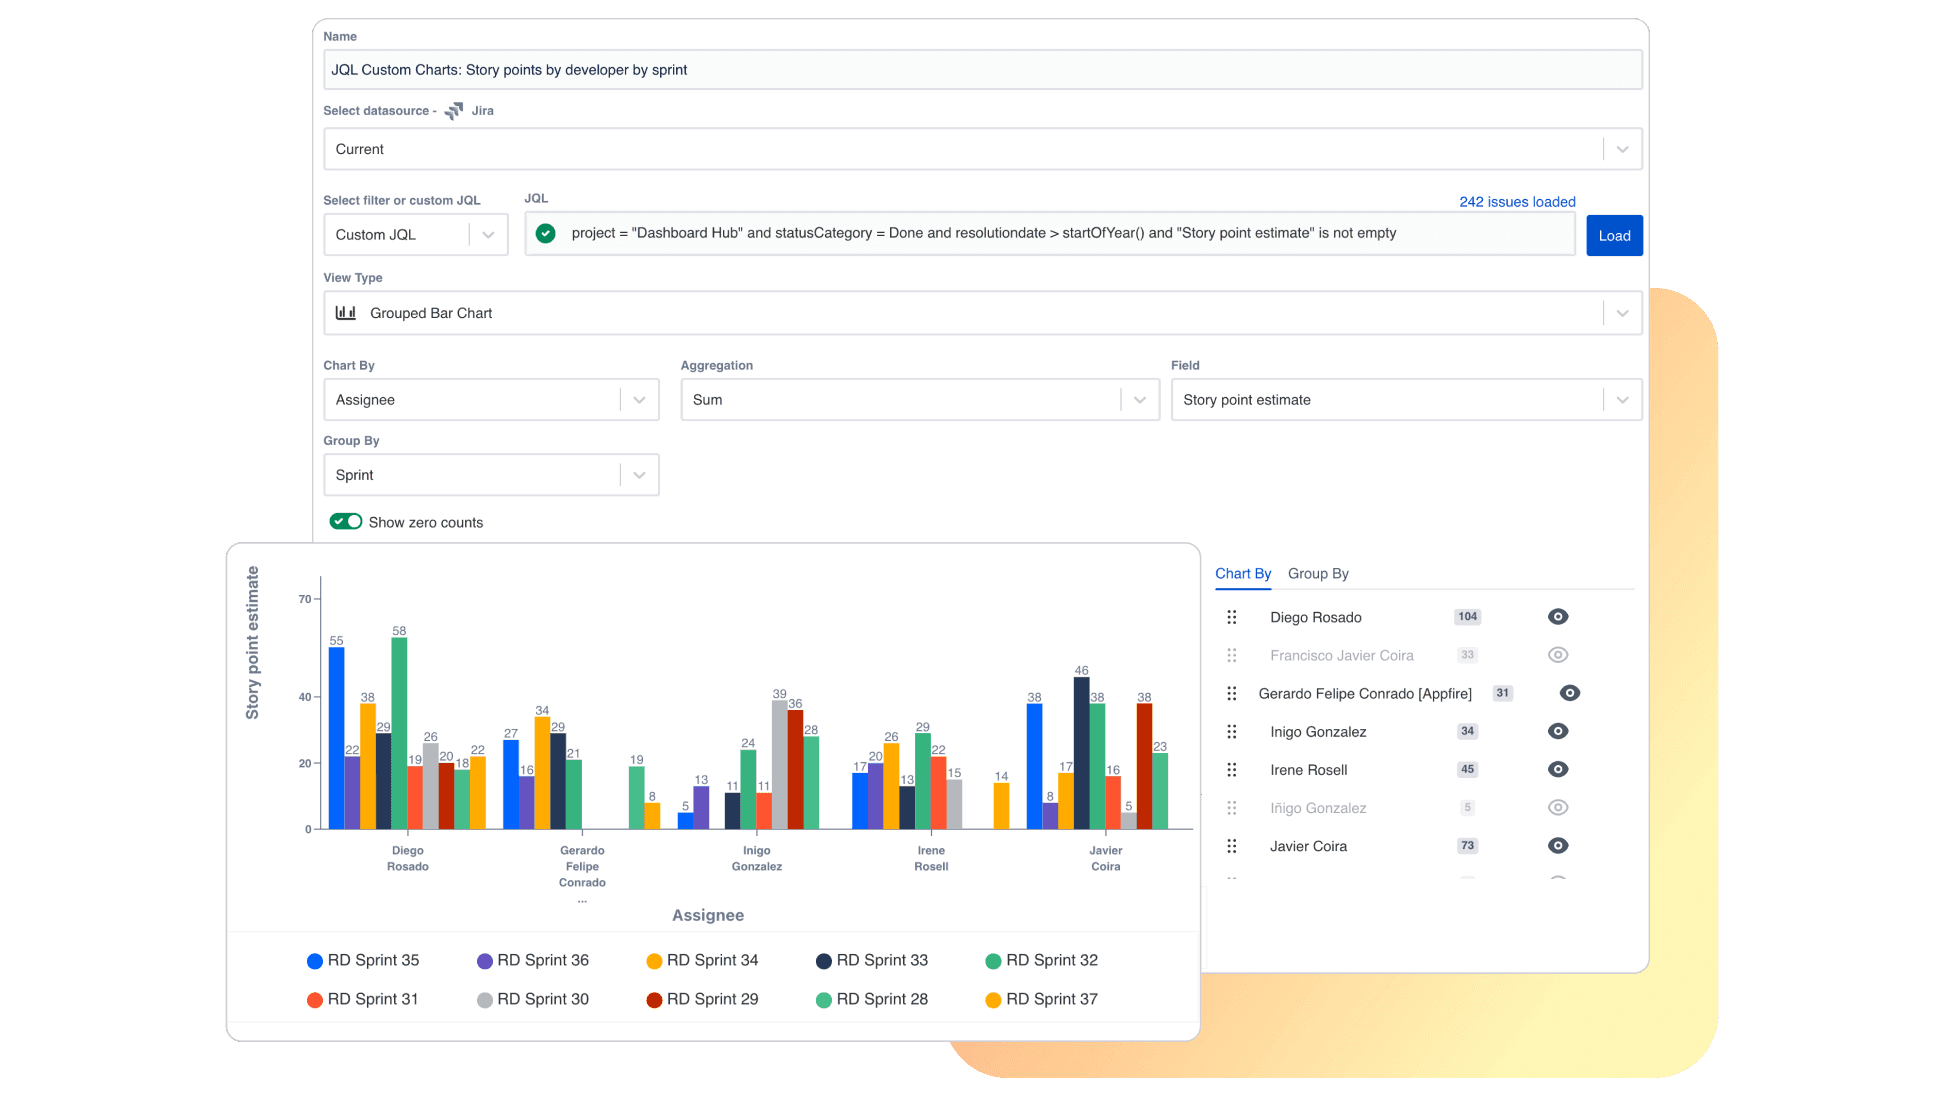
Settings icon

Dynamic filters

Zoom in on certain metrics and indicators using personal and customized filtering options, from entire dashboards to specific gadgets.

Benefit icon

Compatible with native dashboards

Use the whole list of more than 75 powerful metrics and 10 integrations on native Jira dashboards.

Person icon

User-friendly

Start focusing on what’s really important and stop wasting time configuring. Intuitive to use for all technical skill levels.

Notification icon

Bells and whistles

Enjoy slideshow options, dark mode, wallboard mode, auto refresh, Dilbert strip, weather gadget and multi-language features.

I am excited to see where this product goes as the dashboard by itself is a boon compared to JSM’s native views and visual reporting tools, which are sorely lacking.

Collin B.

Great app for displaying the information from any Atlassian service, like the Jira Service Desk, the sprint metrics, etc. Easy to configure and all the information you want in a centralized view.

Jorge M.

I struggled with finding all the KPIs I needed to support my team's development efforts. Dashboard Hub ticks more boxes than I could imagine, and gives me near real-time insight into what my four project-based teams are working on.

James P.

We've been using the Dashboard Hub for about three weeks and it has become an indispensable tool for communicating the effort estimates and tracking the development progress.

Alex C.

Compatible apps 04

Build the perfect dashboard visualization combo

Dashboard Hub logo

Time to SLA

Revise how you report SLAs and other service desk KPIs in Jira while gaining business insights across teams, projects, and Atlassian tools by pulling the robust SLA metrics into sharable, customizable dashboards.

Learn more

BigPicture

Get an overview of BigPicture projects in centralized dashboards. Create cross-team dashboards that help stakeholders and managers get a unified view of multiple projects and their progress, resource utilization, and overall status.

Learn more

Compatible platforms 05

Dashboard Hub for other platforms

Get more done with enterprise collaboration solutions built for your team, your ecosystem, and your best work. When work flows, ideas do too.

Dashboard Hub logo

Level up your Confluence with dashboard and chart macros, redirections, and custom Confluence dashboards.

Resources & News 07

Resources