

Build prioritization scores, dependency signals, and delivery insights in JXL without adding custom fields or forcing a rigid hierarchy.
TL;DR
- Jira shows status. JXL formulas turn that data into insights you can make decisions with.
- Build live prioritization scores and dependency indicators directly inside Jira
- Replace prioritization and reporting in external, static spreadsheets with real-time logic
- Extend with JFL Script for the most complex use cases
- No custom fields or Jira administration changes required
Every team that plans work in Jira knows this moment. The backlog is full. Everything looks important. A few high-impact initiatives are quietly blocked by dependencies. A quick win is consuming more effort than expected. Nothing is obviously broken. The trade-offs just aren't visible.
The data already exists in Jira. It lives in effort estimates, linked issues, blocked work, and business impact fields. Jira stores all of it. It just doesn't calculate what it means.
That's not a Jira problem. It's a logic problem.
JXL is a Jira-native app with lots of powerful features to view, edit, and organize your work. Formulas are JXL's newest capability. They turn Jira data into insights you can act on.
What are Jira formulas in JXL?
Formulas are a special column type in a JXL sheet that computes values across your Jira work items. JXL's formula language, JFL, works exactly like Excel formulas. If you've used functions like IF(), SUM(), or AND() in a spreadsheet, you already know the syntax. The difference is that JFL lives inside Jira and recalculates whenever you update an issue in your sheet — no exports, no manual refresh, no waiting for a dashboard to catch up.
You write a formula once. From that point, every time an issue is edited in the sheet, the value recalculates.
For more complex logic, JFL Script gives technical users full control over multi-condition calculations and advanced scoring. It's a JavaScript and TypeScript-based language, so if you've written JS before it'll feel immediately familiar — and the formula composer in JXL includes autocomplete suggestions and live error feedback as you write.
Formulas compute values inside a JXL sheet without requiring any Jira administration changes. Teams can add or remove formula columns without creating persistent Jira custom fields. And if you want to push a calculated value back into a Jira field, you can do that too — simply copy the formula column and paste it into the target field column directly in your JXL sheet.
Why static Jira fields create blind spots
Back to that backlog. Everything looks manageable. High-priority items are marked. A few large initiatives are in progress. Nothing appears obviously blocked.
But when planning decisions are made, something feels off. A high-impact feature is quietly dependent on work in another team's sprint. A low-effort task is consuming more capacity than expected. A roadmap commitment is technically on track but heavily exposed to upstream risk.
Jira fields describe state, they don't evaluate it.
A priority field tells you how important something is. It doesn't tell you whether that priority still makes sense given effort, dependencies, and business impact. A linked issue shows a dependency. It doesn't calculate how much that dependency affects delivery confidence. Dashboards show counts and statuses, but they don't surface what those relationships mean for sequencing or roadmap risk.
So teams fill the gap. They export data into external spreadsheets to calculate RICE scores, dependency impact, or weighted prioritization models. Or they ask admins to build custom fields that try to encode logic into Jira. Those fields quickly become rigid and hard to adapt.
The insight needed to make better decisions was in Jira the whole time. It needed calculation.
That's what JXL formulas do.
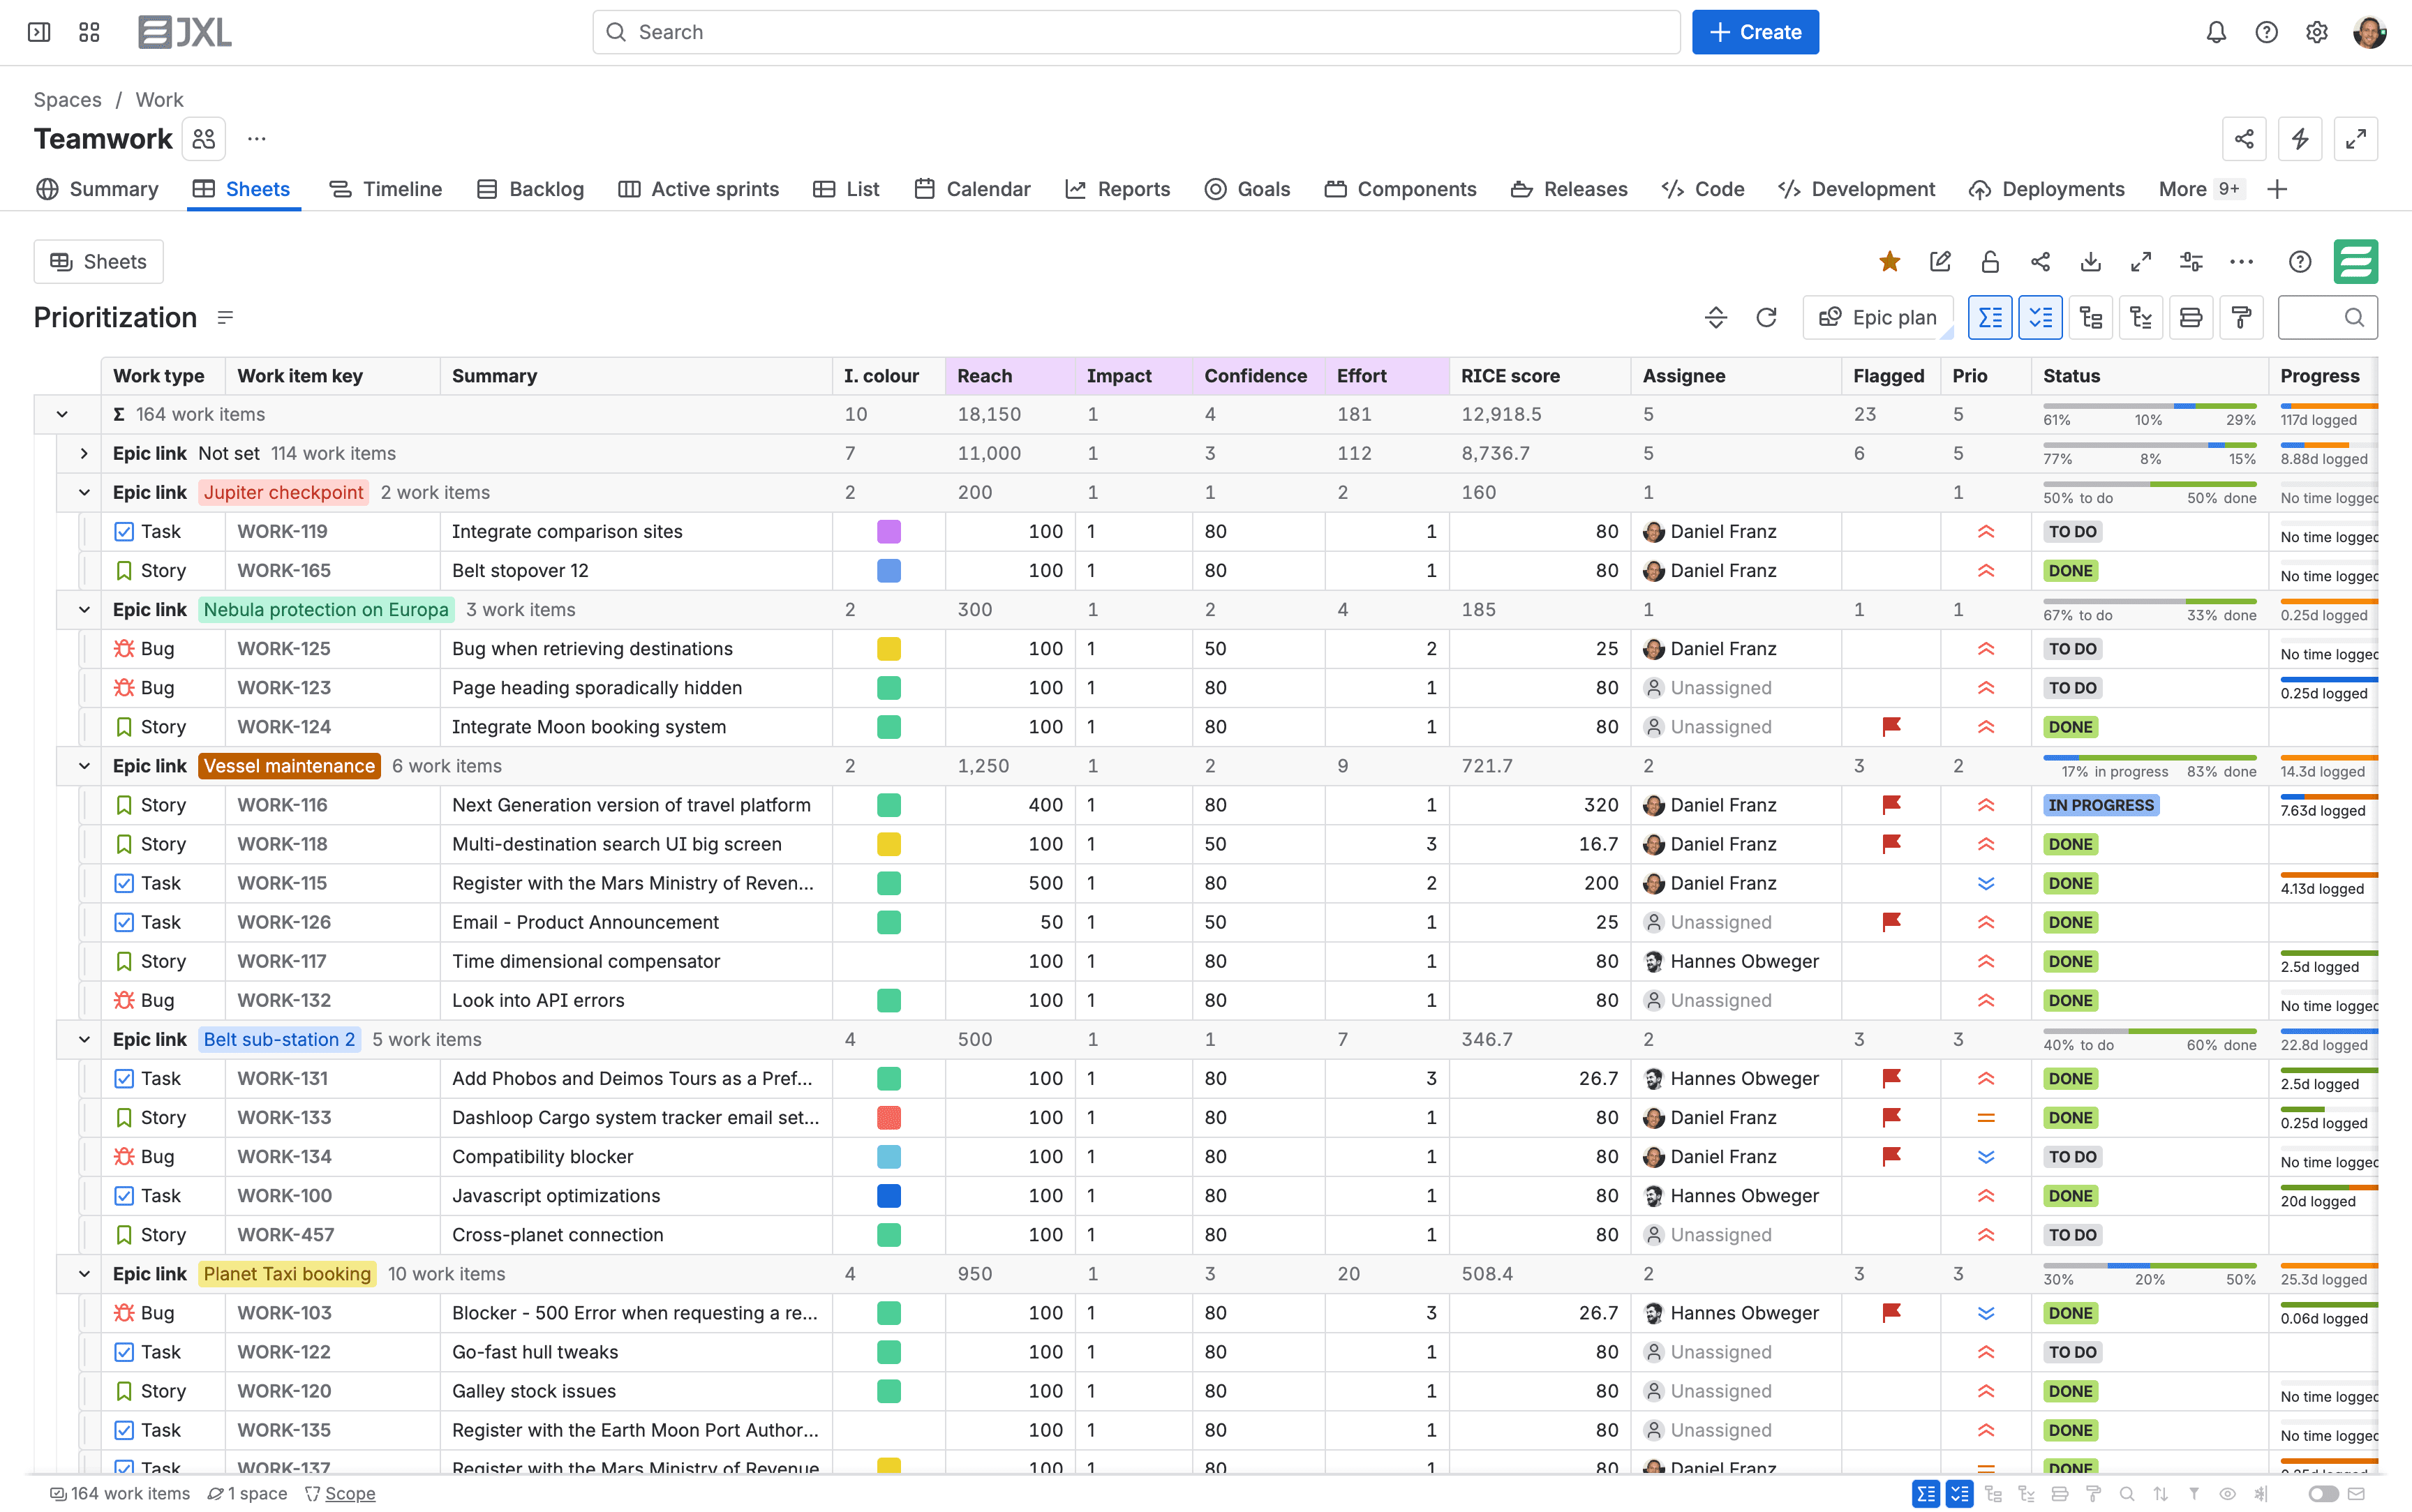
Practical use case: How to build a dynamic prioritization score with formulas
Let's see how JXL Formulas can be used to create a prioritization tool inside Jira. Prioritization looks different across teams. Product managers use RICE. Program managers use weighted delivery scores such as WSJF. Operations teams build capacity models. The underlying need is the same: a consistent, live metric that reflects what deserves attention right now rather than what looked important last week.
This walkthrough uses RICE because it’s widely understood and clearly illustrates the approach. However, it’s just one of many use cases the flexible formula engine supports. WSJF, weighted effort scores, custom capacity models: if the logic can be expressed, JXL can calculate it.
Step 1: Calculate your RICE score in JXL
If your team already uses RICE to prioritize work, you know what it's good at. It gives every initiative a standardized score based on Reach, Impact, Confidence, and Effort. It removes gut feel from the conversation. It creates a shared language for prioritization decisions.
It also has a well-known blind spot. A raw RICE score reflects theoretical value. It doesn't account for what's actually happening in your delivery environment. Which initiatives are blocked. Which are heavier than estimated. Which are exposed to upstream risk.
That's where formulas close the gap.
With a formula column in a JXL sheet, your RICE score lives inside Jira and recalculates as your data changes. No external, static spreadsheet to maintain. No manual scoring session before every planning cycle. Just a live prioritization metric that reflects the current state of your work.
Here's how to set it up. Start by mapping your RICE inputs to their Jira field IDs:
Input | Jira Field ID |
|---|---|
Reach | this.customfield_REACH |
Impact | this.customfield_IMPACT |
Confidence | this.customfield_CONFIDENCE |
Effort | this.customfield_EFFORT |
Note: Custom field IDs are unique to each Jira site and look like customfield_12345. You won't need to look them up manually — as you type a field name in the formula composer, autocomplete suggestions will surface the correct ID for your instance (e.g. start typing "Reach" and the matching field will appear as a suggestion).
Then enter a formula similar to this one in the formula composer:
ROUND((this.customfield_REACH * this.customfield_IMPACT * this.customfield_CONFIDENCE) / this.customfield_EFFORT / 100, 1)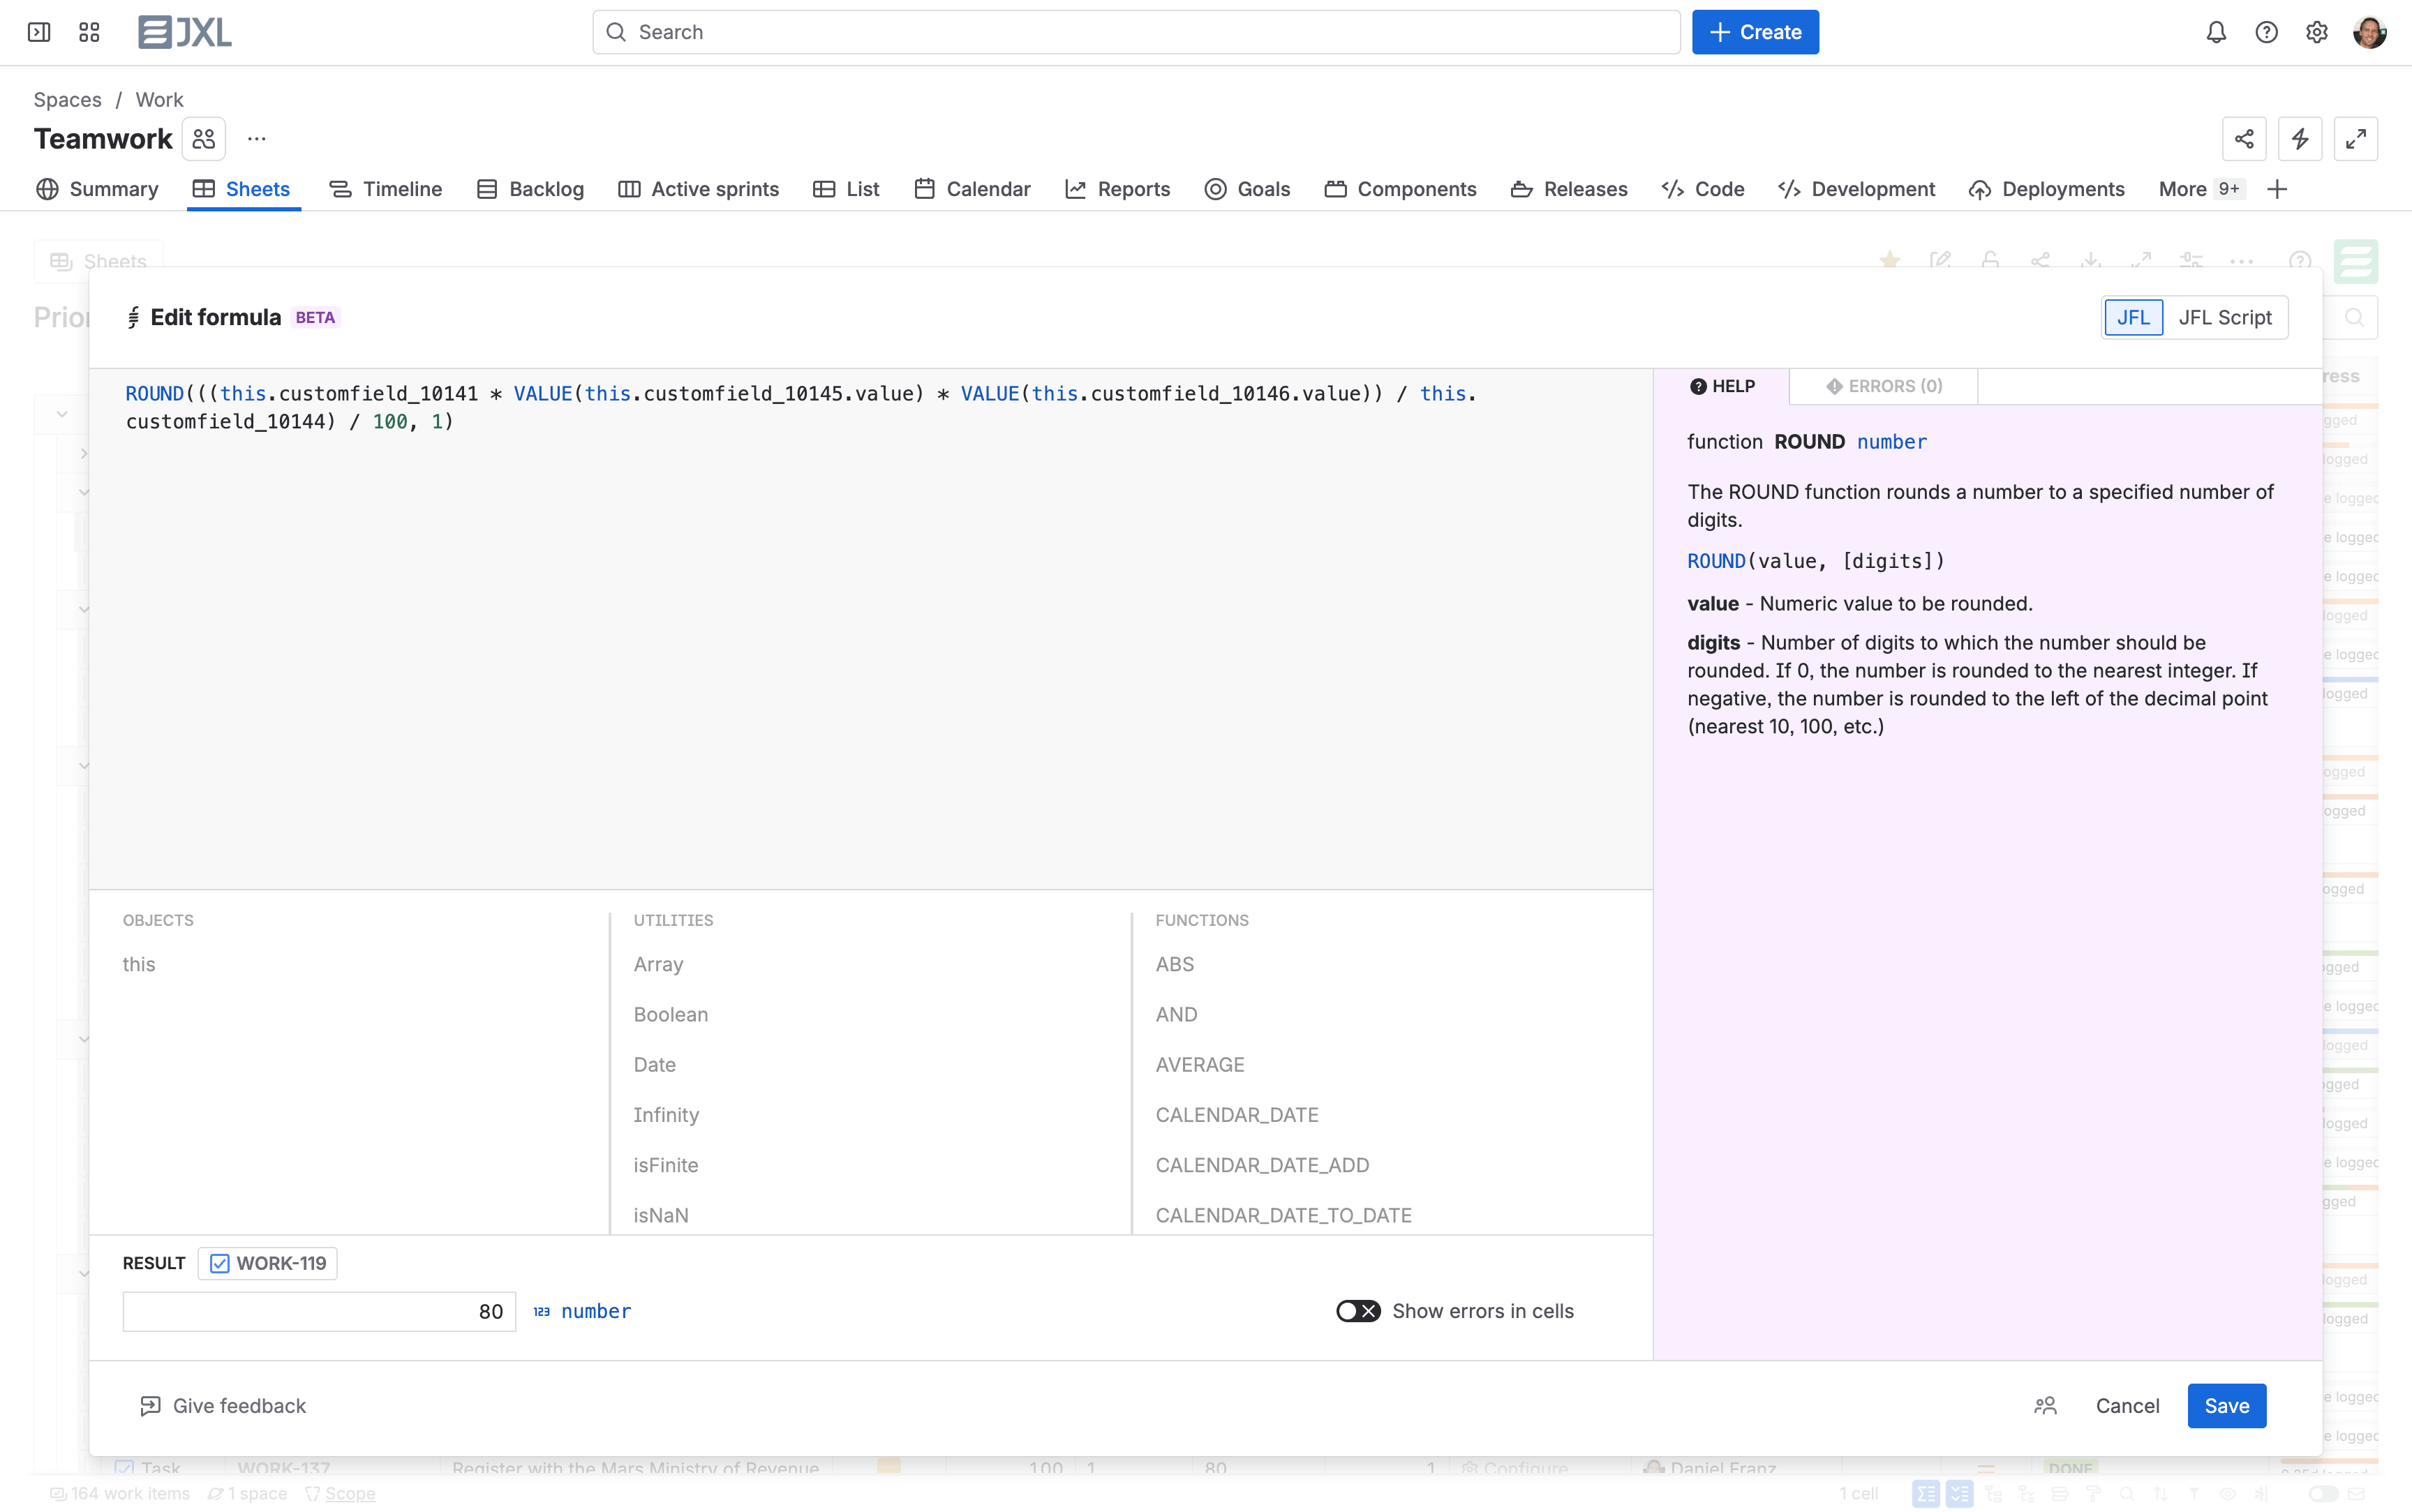
Every work item now has a live score that updates when any input changes in the sheet. The autocomplete suggestions in the formula composer will surface your actual custom field IDs as you type. The same formula structure works for any scoring model your team uses — replace the RICE inputs with whatever fields drive your prioritization decisions and the formula will do the heavy lifting for you.
Step 2: Turn your score into a visual signal
A number still requires interpretation. Is 42 good? Is 18 acceptable? Which item deserves attention this sprint?
Conditional formatting in a JXL sheet lets you apply visual rules directly to your RICE score column. Because the formula result is a number, conditions are defined as number ranges. Set thresholds once and every score in your sheet gets a colour automatically:
- Green = High priority
- Yellow = Medium priority
- Red = Low priority
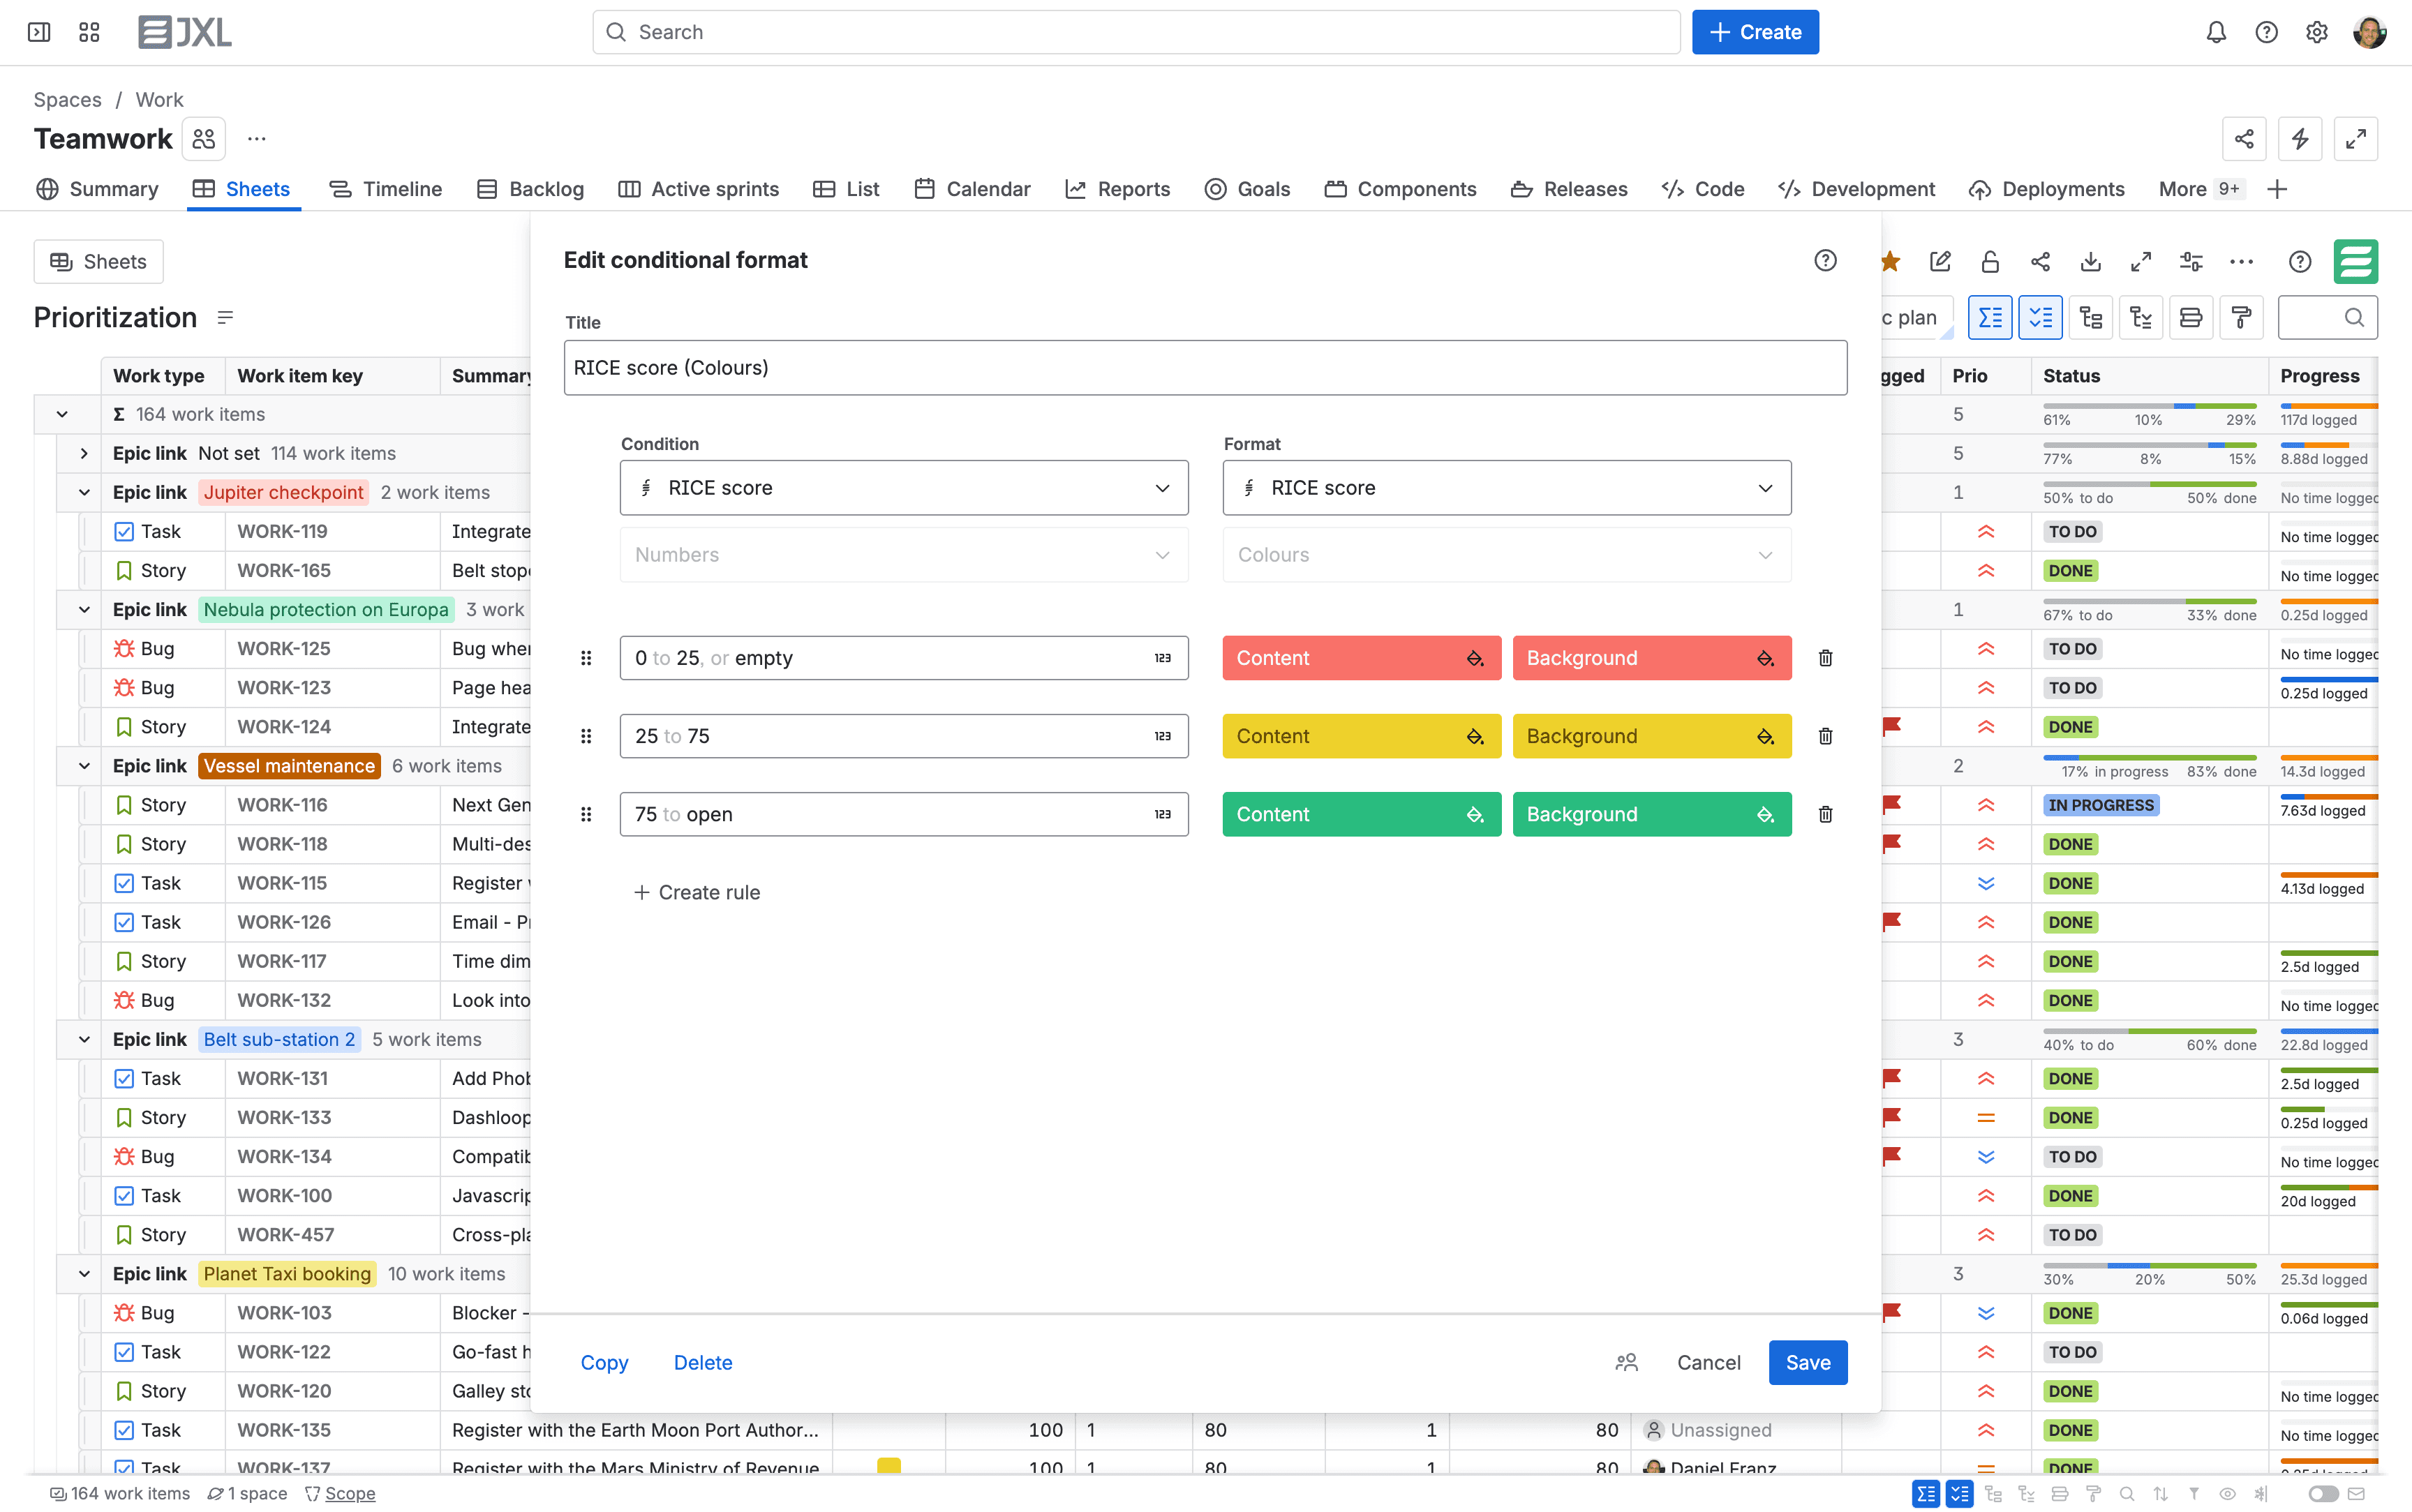
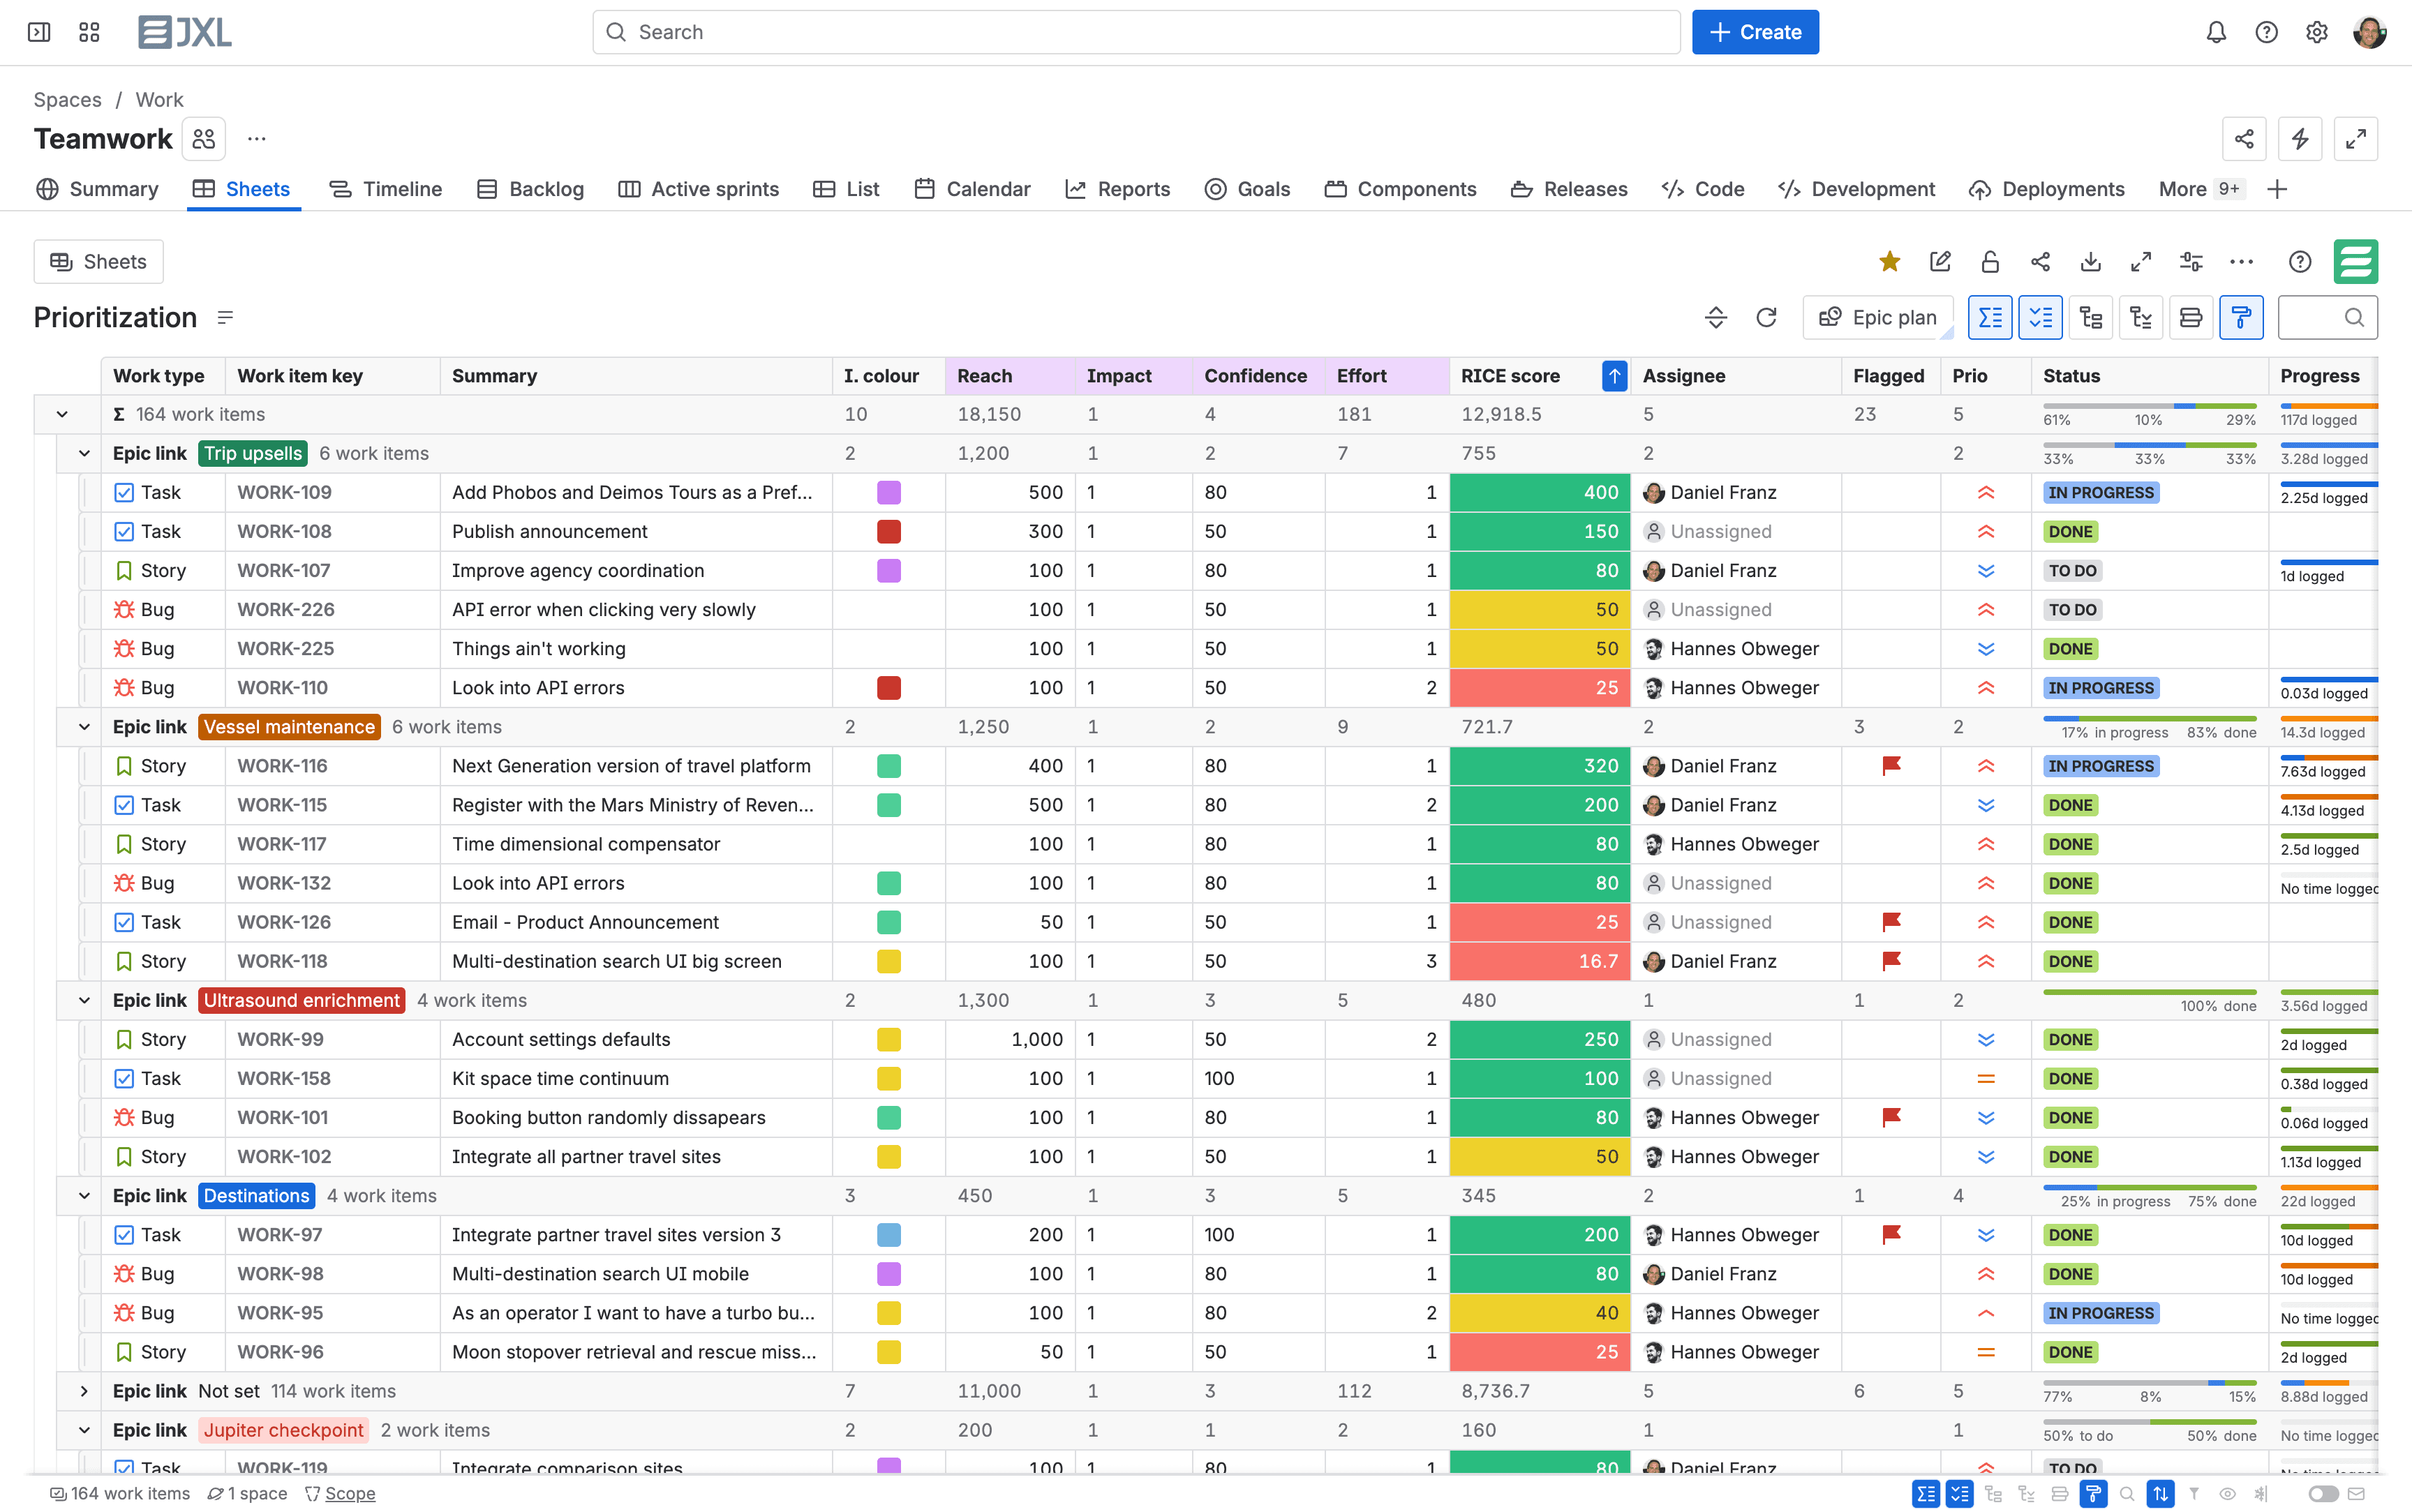
Now the score is visible at a glance. A high-RICE initiative showing yellow signals a risk worth investigating. An unblocked mid-scoring item showing green signals something ready to move. A cluster of red items at the top of your backlog is a conversation worth having before the next planning session.
No external spreadsheet. No manual review before planning. Just a backlog that tells you something useful.
View the language reference, supported functions, and fields in the JXL documentation
How to go even further with JFL Script
The formula above covers a lot of ground. But some logic genuinely requires more than a single expression — and that's exactly where JFL Script earns its place.
JFL Script is JXL's advanced scripting layer. It's a JavaScript and TypeScript-based language, so if you've written JS before the syntax will feel immediately familiar. For everyone else, it's approachable enough to learn. The formula composer includes autocomplete suggestions and live error feedback as you write.
Here's a real example that brings together two things at once: adjusting for dependency risk, and flagging escalation risk across a portfolio of epics.
A team wants to know not just whether something is overdue, but whether the combination of being overdue, stalled, blocked, and over-scoped puts it in genuine danger. They also want to factor in whether an item has blocking dependencies — and rather than counting all linked issues, they want to target only "is blocked by" link types for a more precise signal.
Any one of those conditions alone might be manageable. All of them together is a different situation. In an external spreadsheet, this logic sprawls across multiple columns and breaks the moment your data structure changes. In a JXL sheet, it lives in a single formula column:
// Calculate escalation risk based on multiple conditions
let isOverdue = (this.timeSinceDueDate ?? 0) > 0;
let isStale = this.timeSinceStatusChanged ?? 0) / 86400000 > 3;
let isBlocked = this.flagged === true;
let highStoryPoints = (this.storyPoints ?? 0) > 20;

// Escalation Risk if overdue AND blocked, or overdue AND stale AND over-scoped
if (isOverdue && isBlocked) {
    return "Escalation Risk";
}
if (isOverdue && isStale && highStoryPoints) {
    return "Escalation Risk";
}
// Monitor if stale and blocked, or showing any single warning sign
if (isStale && isBlocked) {
    return "Monitor";
}
if (isOverdue || isBlocked) {
    return "Monitor";
}
return "On Track";
The ?? operator handles empty and null values cleanly. For example, if storyPoints isn't set on a work item, it defaults to 0 rather than throwing an error. Each condition is stored as a named variable before the logic runs, which makes the script easy to read, adjust, and hand off to someone else. The return statement at each decision point publishes that value directly to the formula column cell.
The output is a live escalation risk label on every epic — Escalation Risk, Monitor, or On Track — recalculating whenever issues are updated in the sheet. The story point threshold of 20 and the stale threshold of 3 days are starting points. Adjust them to match your team's definition of risk.
This is where JFL Script makes sense. It lets you structure logic that spans multiple conditions, name each one clearly, and maintain it over time without it becoming a sprawling nested formula nobody wants to touch.
JFL Script also supports accessing parent issue data via this.parent, meaning you can write conditions that factor in a parent epic's due date or status alongside the child issue's own fields. This makes it possible to build risk signals that reflect the full hierarchy — not just the item in front of you.
How formulas simplify Jira Cloud migration
The logic you just built (a live RICE score with visual priority signals, and a multi-condition escalation risk indicator) is exactly the kind of calculated field that teams running Jira Data Center have spent years trying to replicate with ScriptRunner scripts, Groovy post-functions, and custom field configurations.
Most Data Center reporting logic doesn't migrate cleanly. ScriptRunner-based patterns require significant rework in Cloud. Custom field logic that took months to develop often ends up on a list of things to figure out later that never quite gets addressed. The result is teams arriving in Cloud with less reporting capability than they left behind.
JXL changes that equation. Here's a concrete example of what the difference looks like:
Data Center approach | JXL sheet | |
|---|---|---|
Setup | ScriptRunner calculated field, typically configured by admin or developer | Formula column added directly in JXL sheet |
Logic | Groovy script maintained in codebase | JFL Script or Excel-like syntax in JXL sheet |
Jira administration | New custom field added to Jira | No Jira administration changes required |
Maintenance | Developer or admin dependency | Editable by the team in JXL sheet |
Flexibility | Rigid once configured | Adjustable on the fly |
Any JXL user can create a sheet, manage its permissions, and update the logic themselves — no admin request, no IT dependency, no developer involvement. Formula columns live in the sheet, not in Jira's configuration, so they don't touch your source data or pollute your Jira setup.
The same team. The same Jira board. But the view is different now.
Alongside the standard fields (status, assignee, due date) there are new columns delivering live insights: a RICE score on every initiative, a colour signal that makes trade-offs visible, and an escalation risk indicator that tells you which epics need attention before they become a problem.
No external spreadsheet was opened. No custom fields were created.
Formulas and scripts in JXL sheets mean prioritization decisions can be grounded in live Jira data rather than a static file that was accurate last Tuesday. And if you built calculated field logic in Data Center, it now has a home in Cloud that's powerful, flexible, and instantly familiar. Make decisions right where your work lives.
Get more from Jira with Formulas in JXL