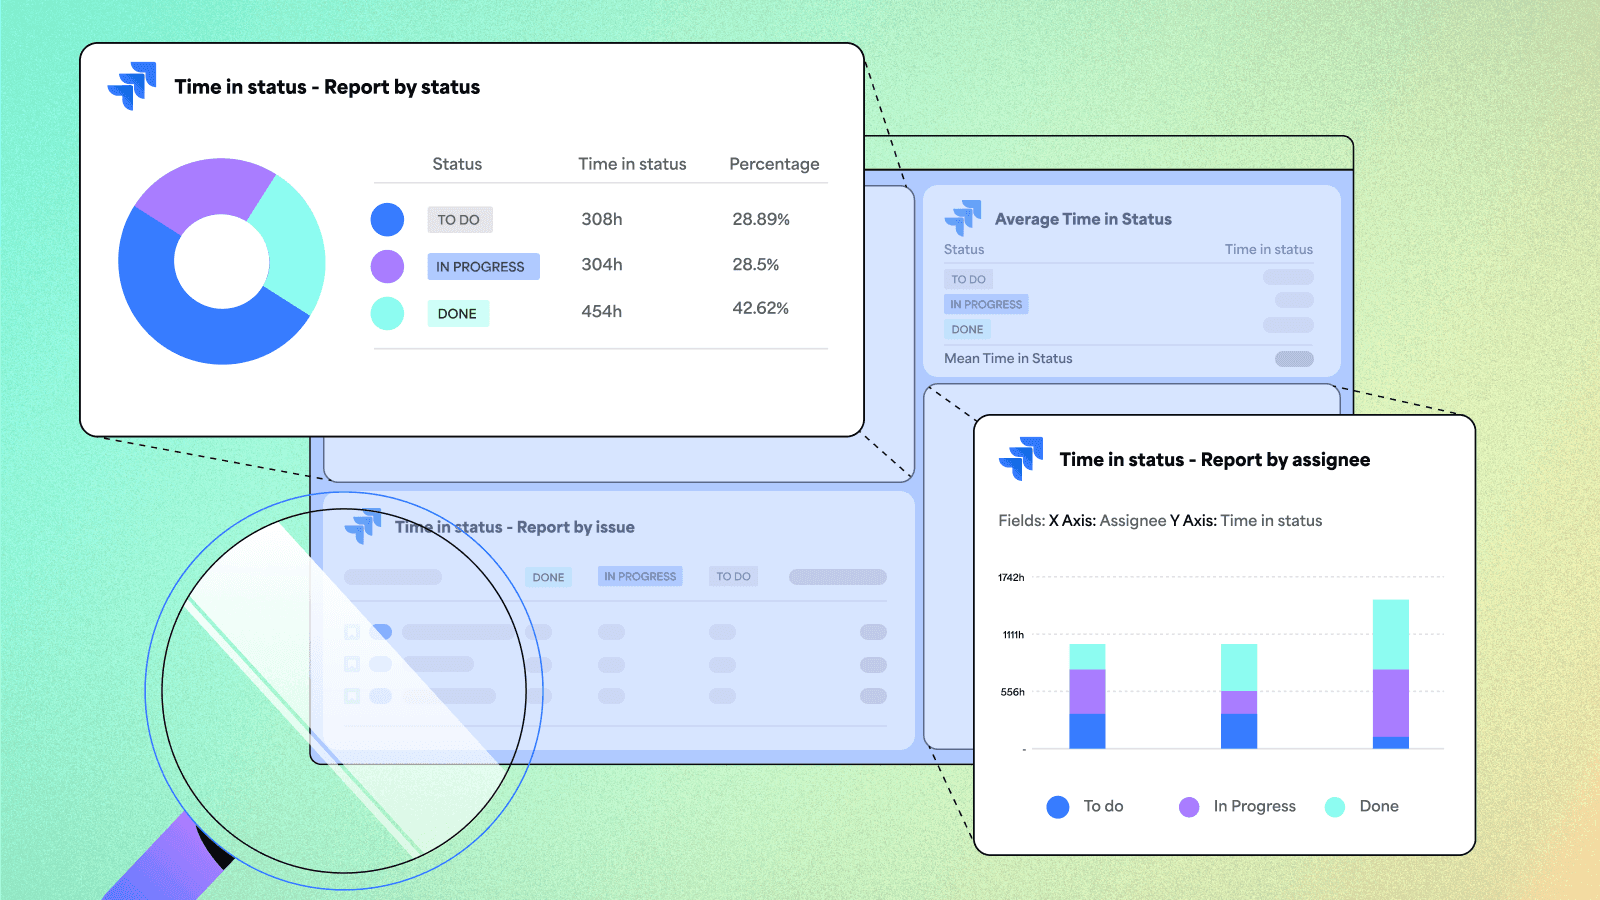

Introduction
Few metrics can be as impactful for project management in Jira as Time in Status, which enables you to track status changes and time spent on tasks in Jira. With Time in Status, you can easily identify bottlenecks, evaluate performance, analyze issues, and create cross-project reports.
If you’re wondering how much time was spent on a task in each of its statuses, and by who, you’ll be glad you implemented this metric into your workflow.
In this article, you’ll learn how to calculate time in each status in Jira.
How to create a Jira time in status report with built-in features
There are two ways to display Time in Status in Jira natively:
Use Jira built-in reports and gadgets
Jira offers built-in reports like "Time Tracking Report" and "Control Chart" and dashboard gadgets such as “Two Dimensional Filter Statistics” that provide insights into time-related metrics. Although these reports may not explicitly show Jira Time in Status, they can still offer valuable information about issue lifecycles and workflow efficiency.
Use Jira Automation
Creating custom fields and building automation rules could help calculate the time between different statuses. But building and sustaining this can prove challenging, requiring repetition for each status time you want to monitor, and it lacks functionality for past issues.
As a result, the built-in functionality for creating Jira Time in Status reports can be very limiting. So, what is the best way to display Time in Status in Jira? Got you covered!
The time in status gadget for Jira dashboards
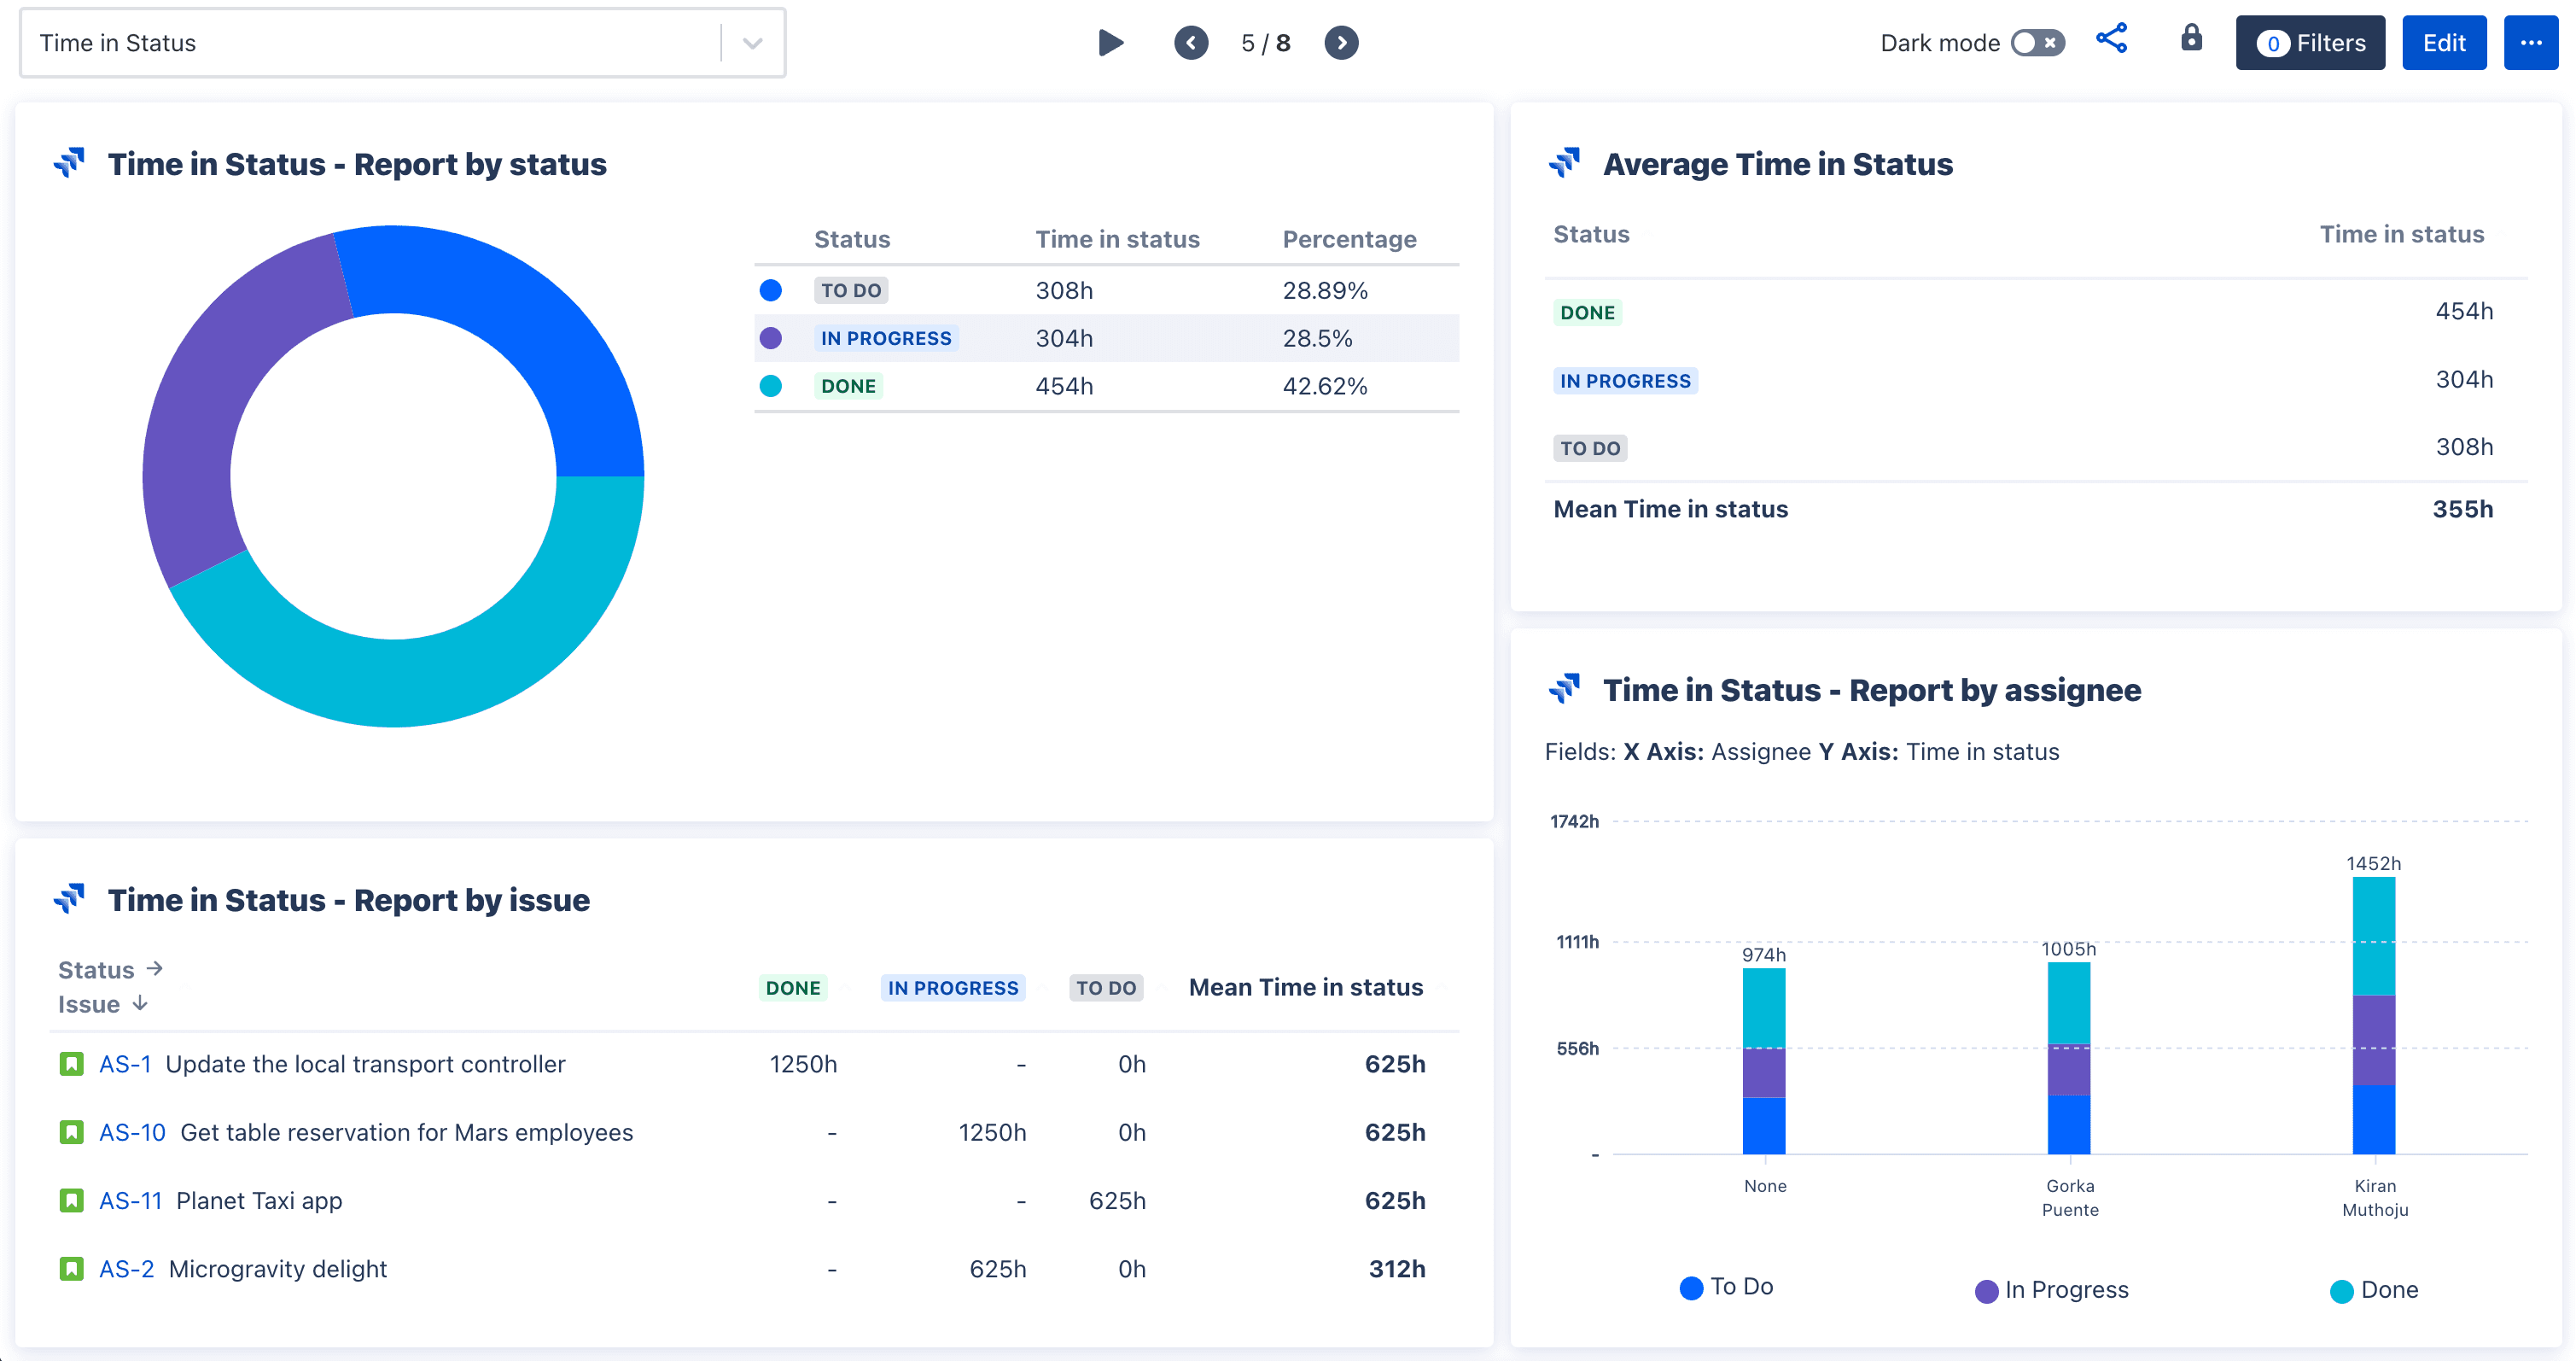
Dashboard Hub Pro provides a customizable and easily sharable Jira Time in Status chart gadget, specifically designed to display Jira Time in Status values on Jira dashboards. Jira users can now show on a dashboard report the time spent in a status, like the time spend to complete a task.
Know how to read a Time in Status chart? Yes, you do! Because this gadget has been designed so anyone in the team can read, create, and share Jira Time in Status reports for their team, regardless of technical skills.
Here are some ways this easy-to-use metric can be helpful:
Track time spent in each status (or in a particular status)
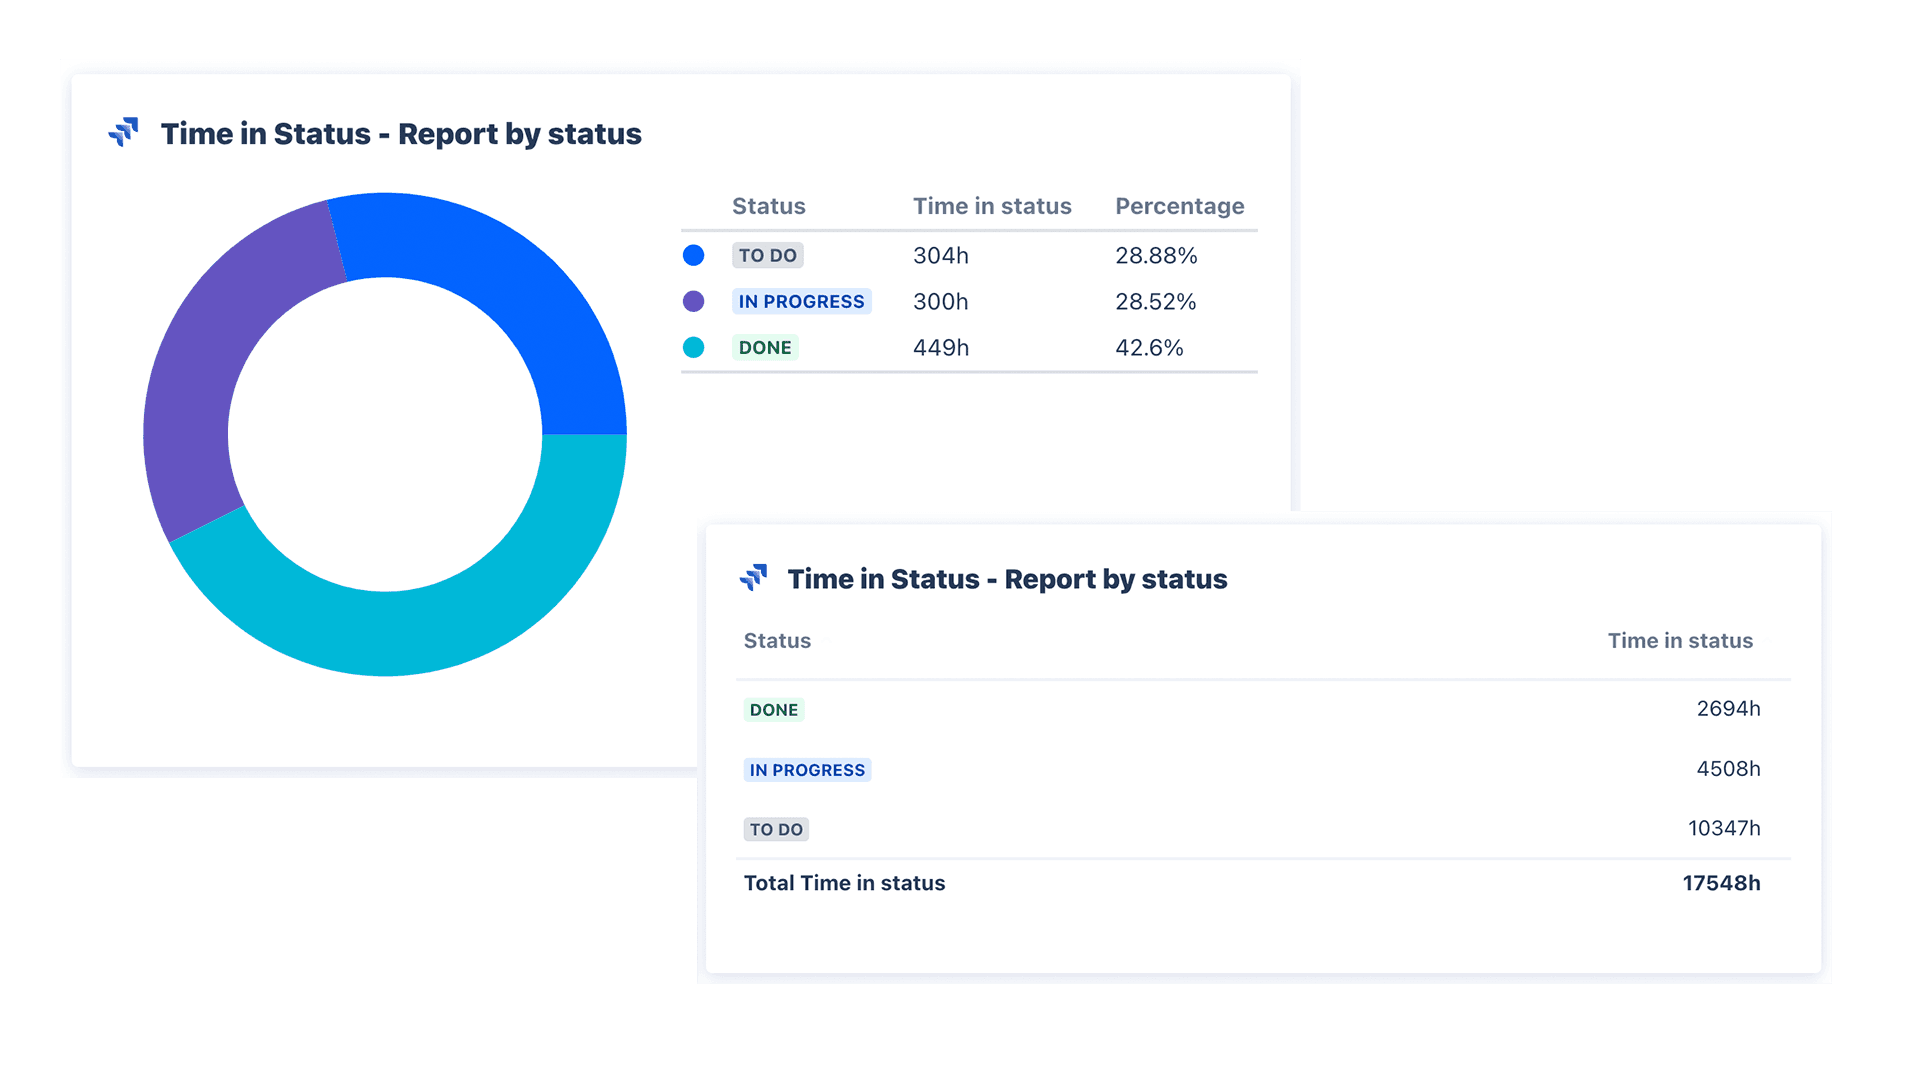
The most common Time in Status use case in Jira is to know how much time each issue spend in each status or a particular status (for example, in the “Open” status) — which helps you to identify bottlenecks.
To achieve this, the Jira Time in Status gadget enables you to easily see the time spent in each status in a given project.
See average time in status
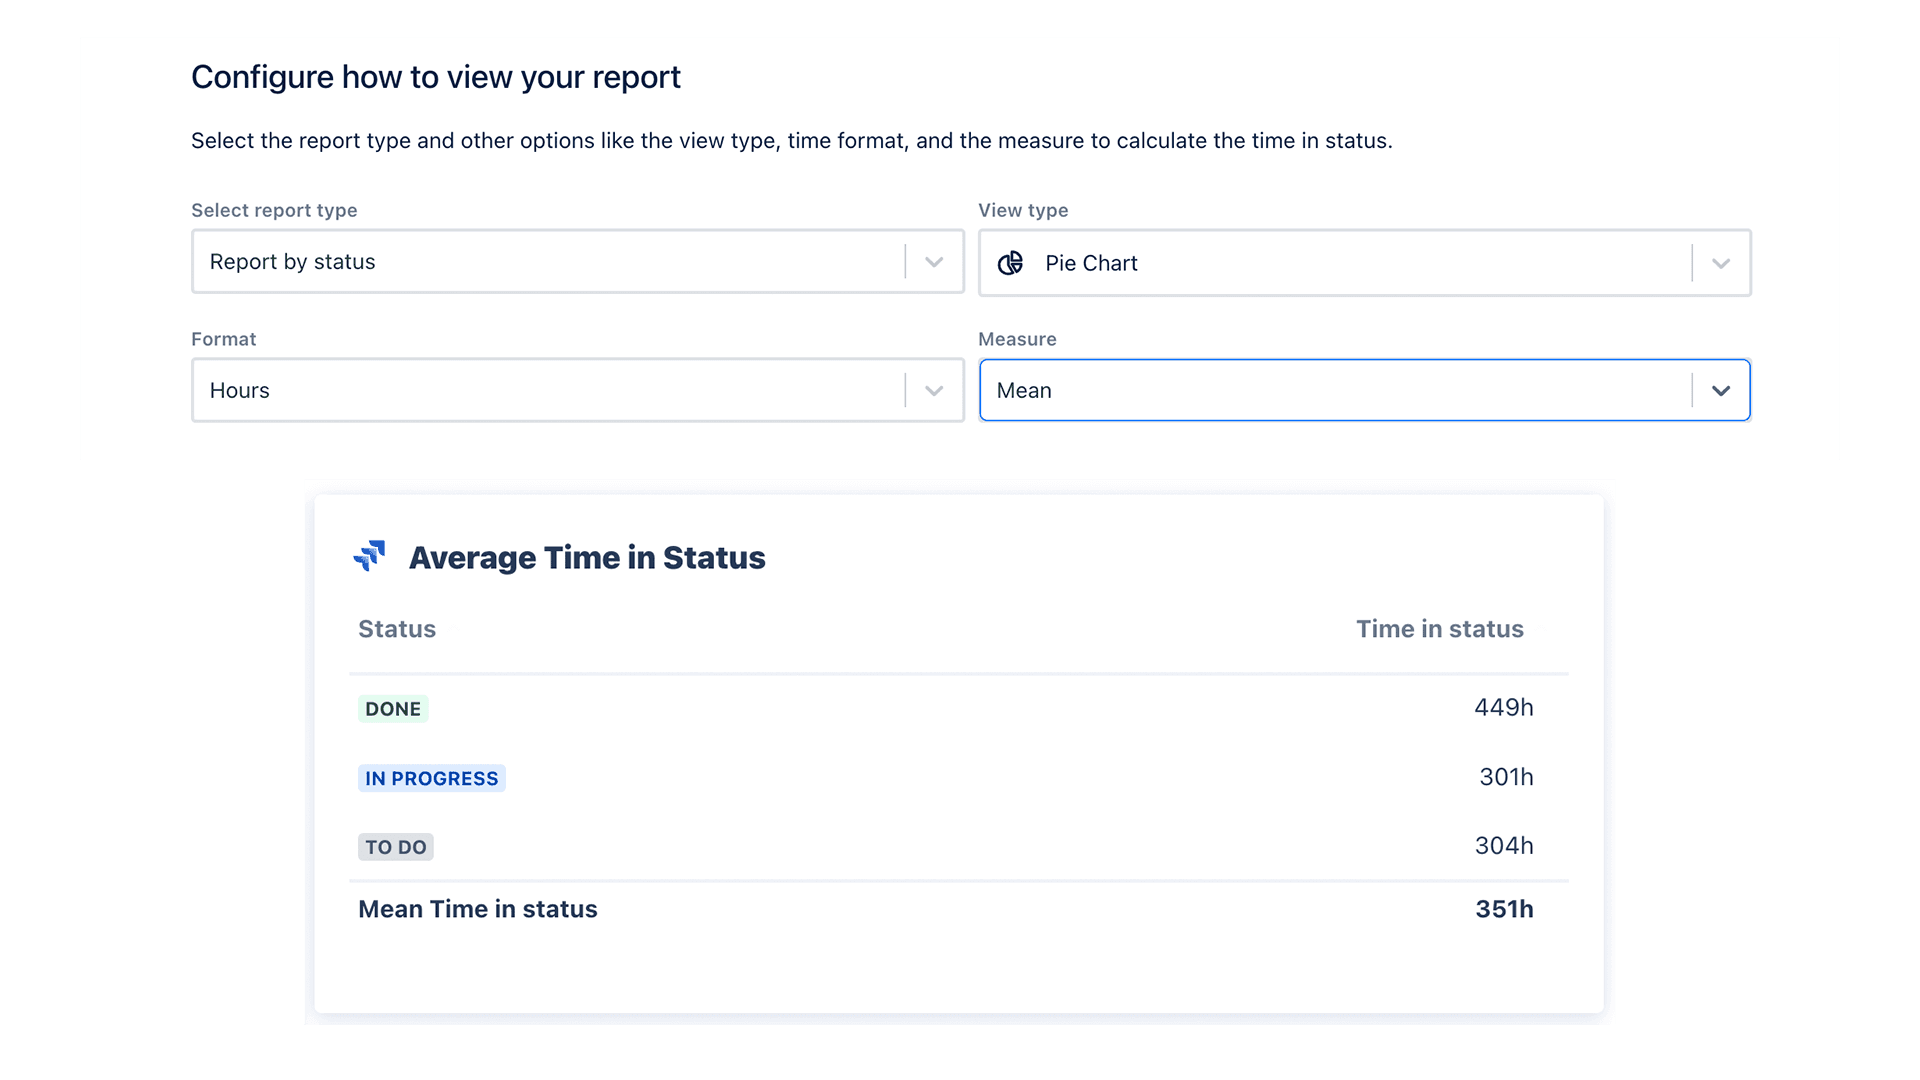
With the Jira Time in Status gadget, it’s easy to create a report that shows the average time issues are in a particular status (for example, the average time the issues are in the “Waiting for support” status). The gadget tackles this by providing a “Mean” measure type that allows us to calculate the average time in status.
Know how much time a developer or assignee spent on a particular status
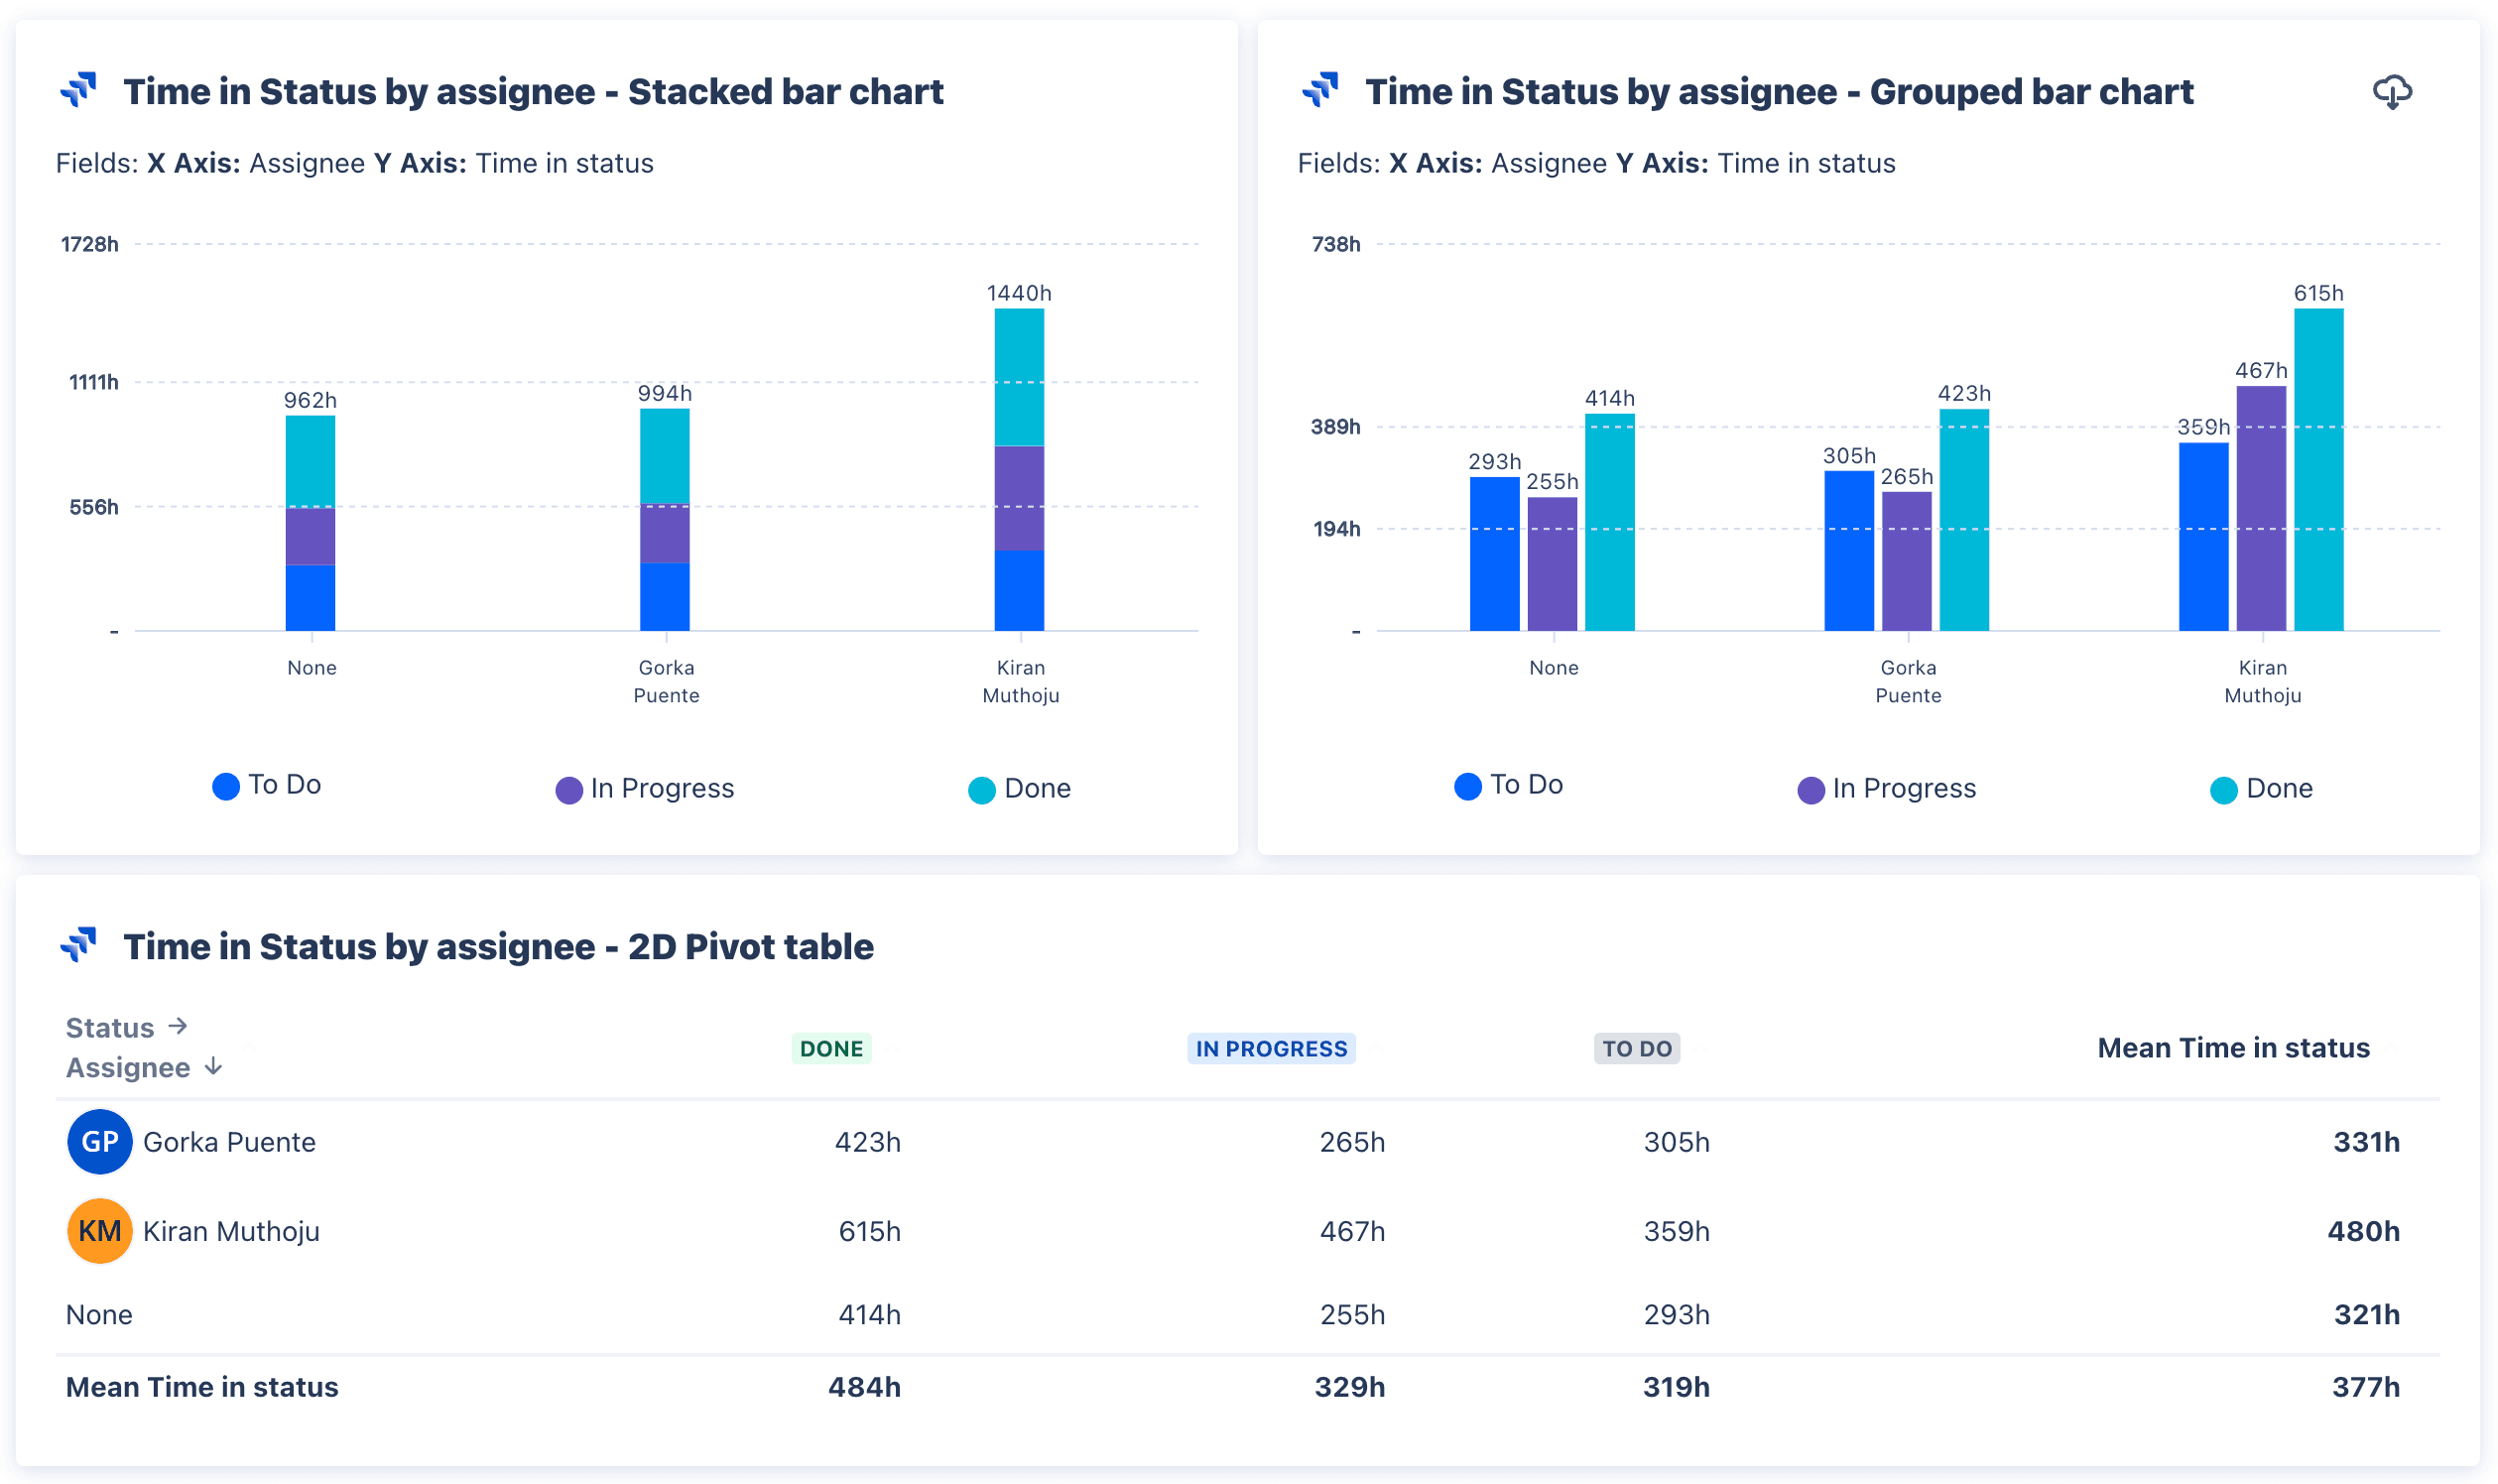
Knowing the time spent in each status is valuable, but getting a breakdown of how much time a specific user has spent on the task is crucial for performance evaluation. With the Jira Time in Status gadget, you can show the amount of time each user spent on a task and track status changes easily.
Adapt your data visualization with view types including stacked bar chart, 2D pivot table, and grouped bar chart to see time spent by project users at a specific status.
The Jira Time in Status chart can also be configured to show the average time spent by the project users at a specific status.
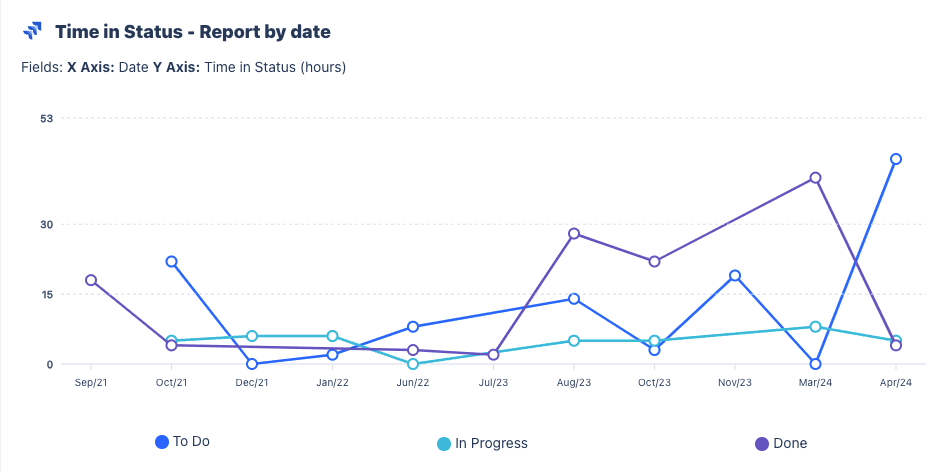
See time in status by date
Do you need to track the time in status over time so you know how much time issues spent in each status in days, weeks, or months? The Jira Time in Status chart allows you to see how the time in status of issues evolves by plotting against a timeline. This way, teams can track and analyze status durations.
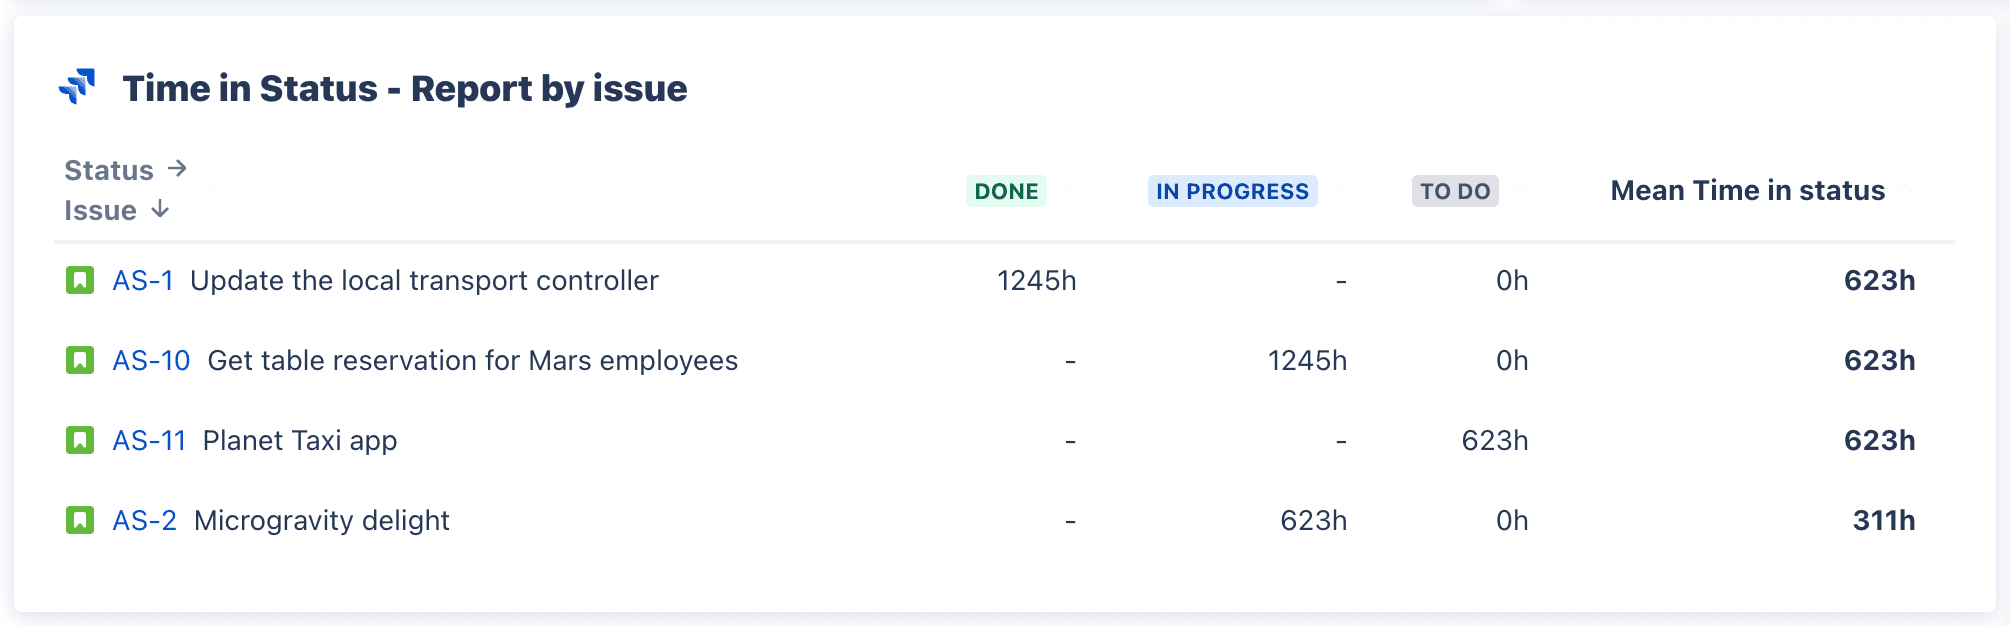
Get time spent in certain status per issue
If you need to know the time spent on a particular status per issue, use the Jira Time in Status gadget to dive deep into individual issues. Use this data to understand their status progression throughout the lifecycle and identify areas for improvement.
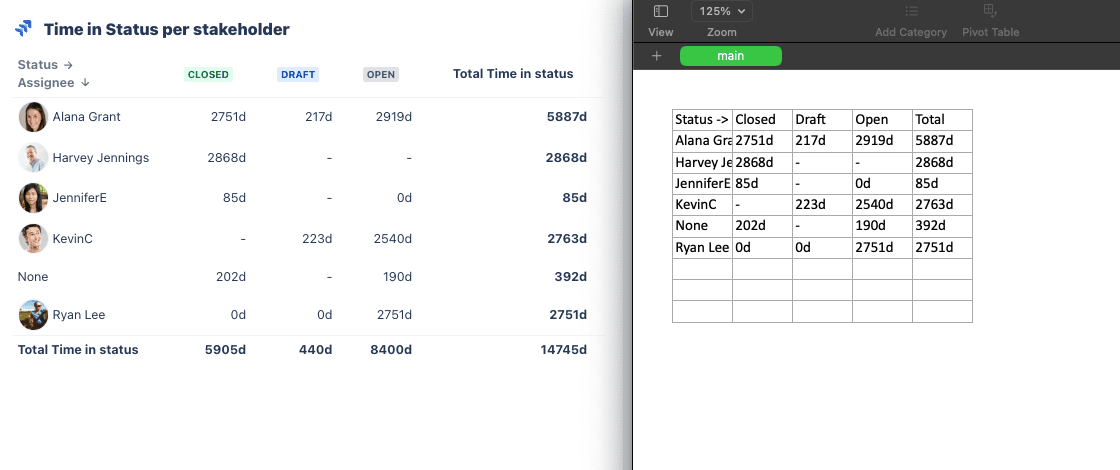
Export Time in Status
Time in Status export to Excel, CSV, and even PNG is also possible with the Jira Time in Status gadget. If you need to export status change history from Jira, you can save countless of hours of manual work and improve the quality of your reports by exporting Time in Status directly — without any additional configurations.
Create time in status JQL reports
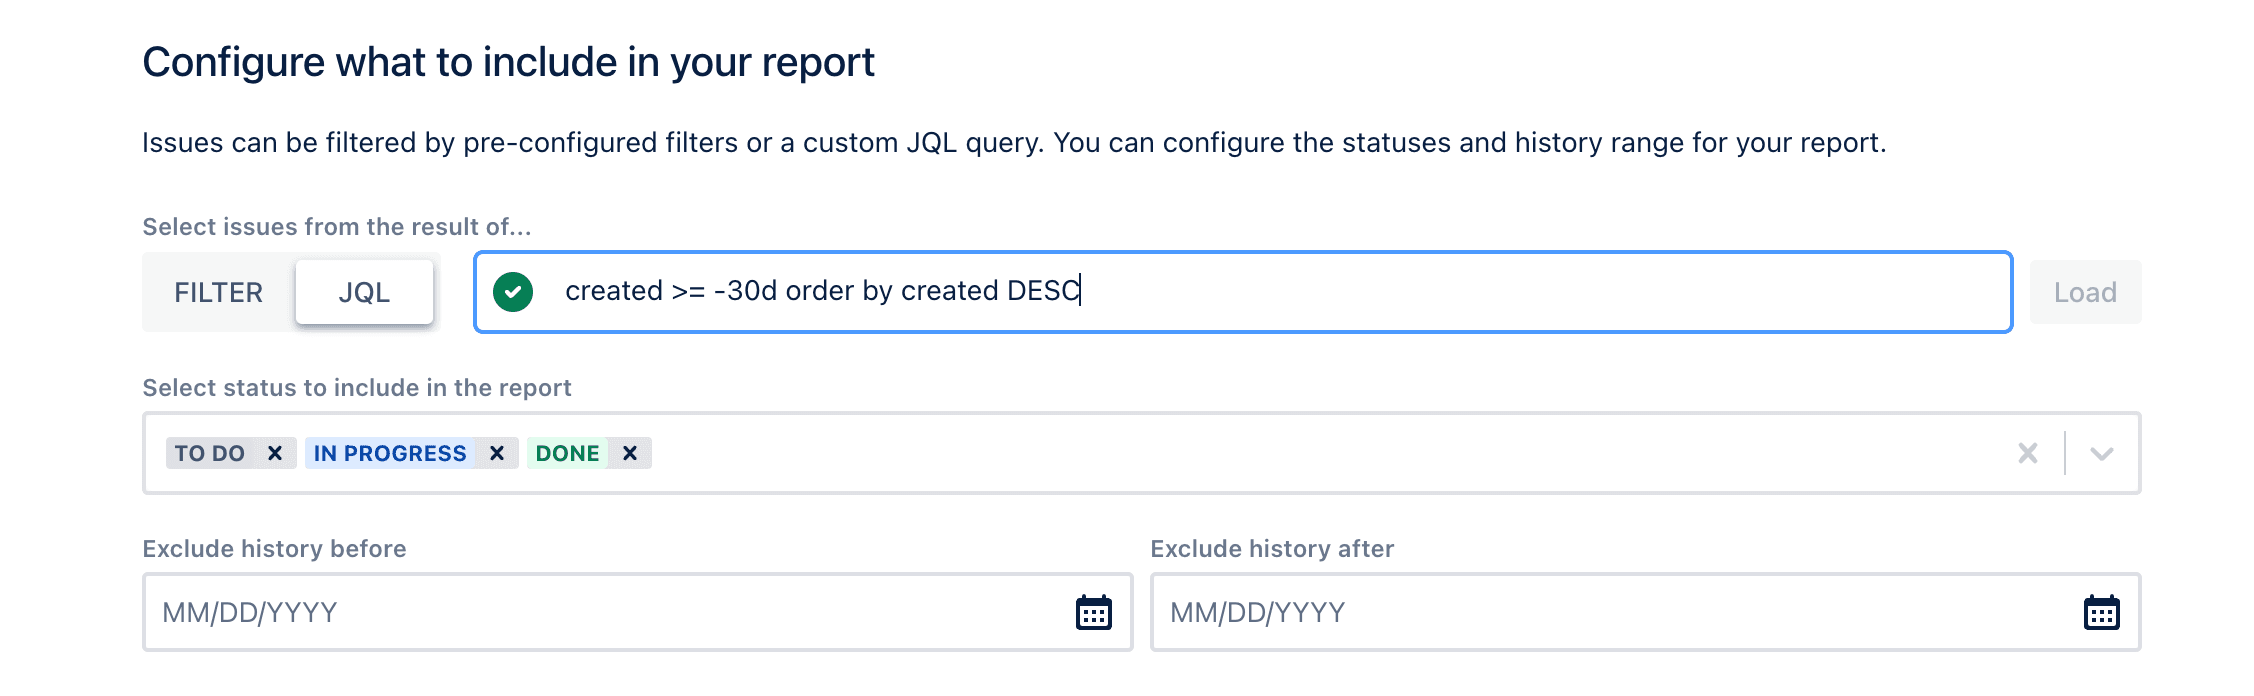
You can customize the Jira Time in Status gadget using Jira Query Language (JQL). This is immensely helpful for retrieving issues based on specific criteria.
By creating Jira Time in Status reports with JQL, you can filter for issues with specific time in status, or even filter for issues exceeding a defined number of days/months in a specific status. Another great use case is the exclude history, which enables you to filter out historical data within a specified timeframe, allowing you to trim the history of your issues so your report is more precise.
Conclusion
Reporting on Time in Status in Jira is possible natively. If your team can handle task repetition and doesn’t need more than basic insights, built-in Jira Time in Status features are a great option. But if you’re looking to leverage all the insights and advantages that a great Time in Status functionality can provide, try the Jira Time in Status gadget free for 30 days — and discover the best version of your team.
Try Dashboard Hub Pro free