Rich Filters for Jira Dashboards

Your single reporting

rich-filters.svg screen in Jira

Your single reporting

rich-filters.svg screen in Jira

Get the perspective you need thanks to dynamic and interactive Jira dashboards with powerful filtering options.

Get the perspective you need thanks to dynamic and interactive Jira dashboards with powerful filtering options.

Cloud fortified iconCloud fortified

Assessed for scale iconAssessed for scale

24 hour support icon24/5 support

Reliability checks iconReliability checks

Key benefits 01

Bolt icon

Less setup, more impact

Unlock data-driven decisions in seconds with intuitive screens and simple configuration.

Touch icon

Interactive reports

Dynamically filter, shape views, and manage issues right on your Jira dashboards.

Finance icon

Drive informed decisions

Tailor dynamic charts and stats to your needs. Turn Jira data into powerful visualizations that guide strategic decisions.

Shield icon

Consistency, built in

Use rich filters to keep dashboard reporting secure, consistent, and governed across teams.
Customers 02

Teams who trust us

Key features 03

One dashboard does the job of many

Get the view you need

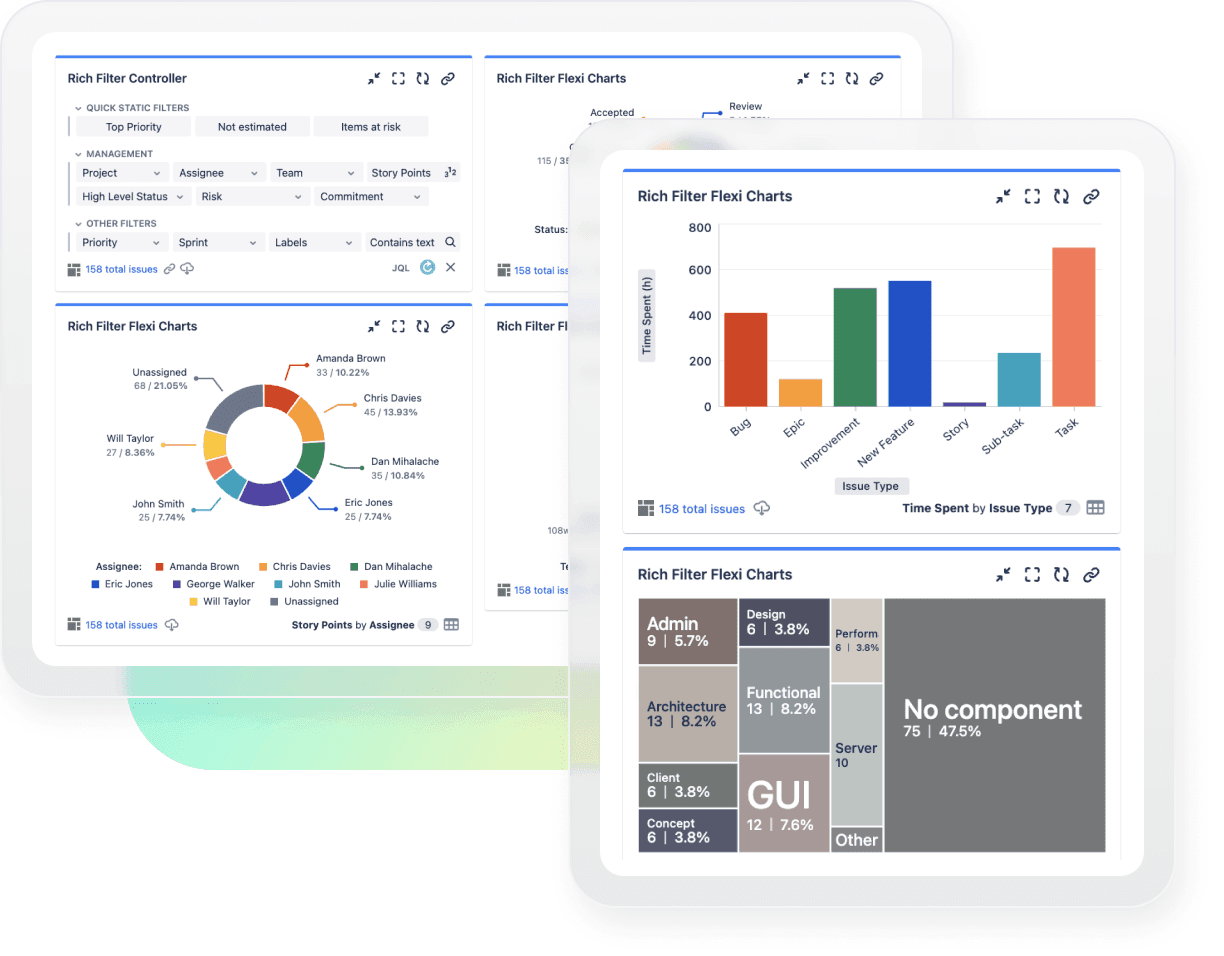
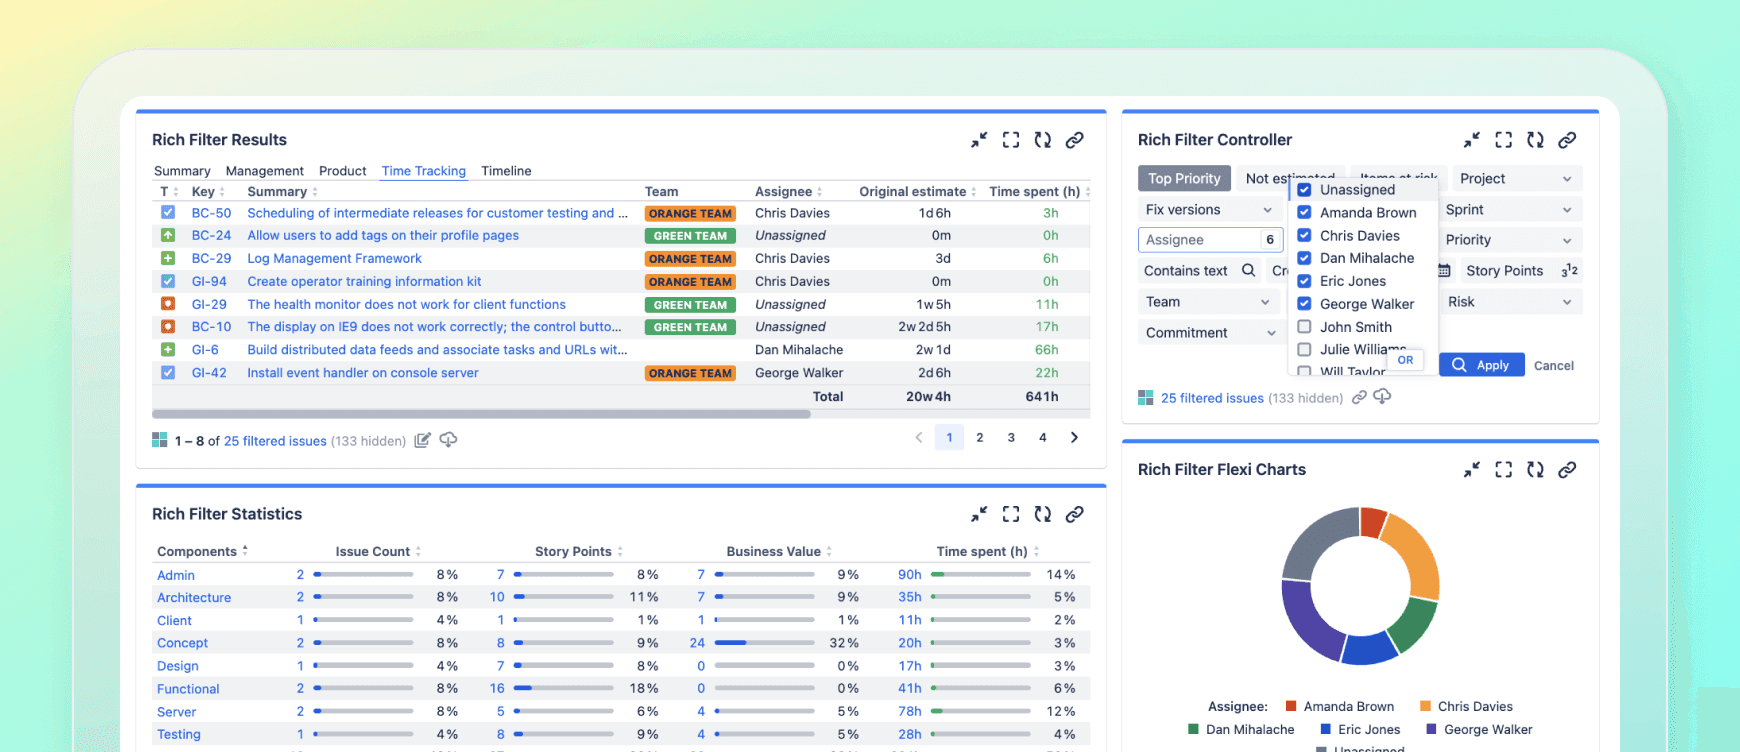
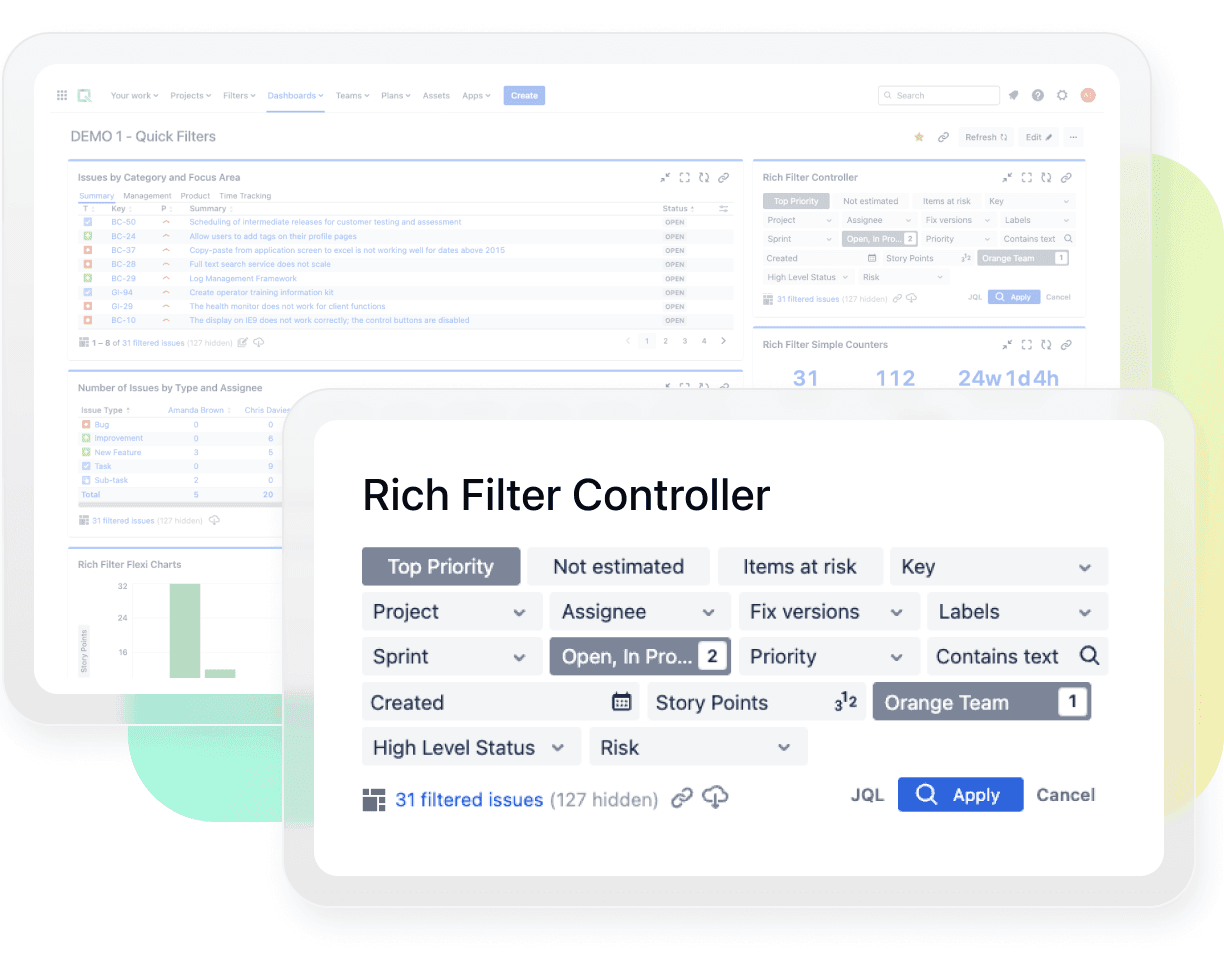
Focus your dashboard on what matters. Use dynamic filters to tailor visualizations by context, user, or level of detail.

Focus your dashboard on what matters. Use dynamic filters to tailor visualizations by context, user, or level of detail.

Understand your Jira data

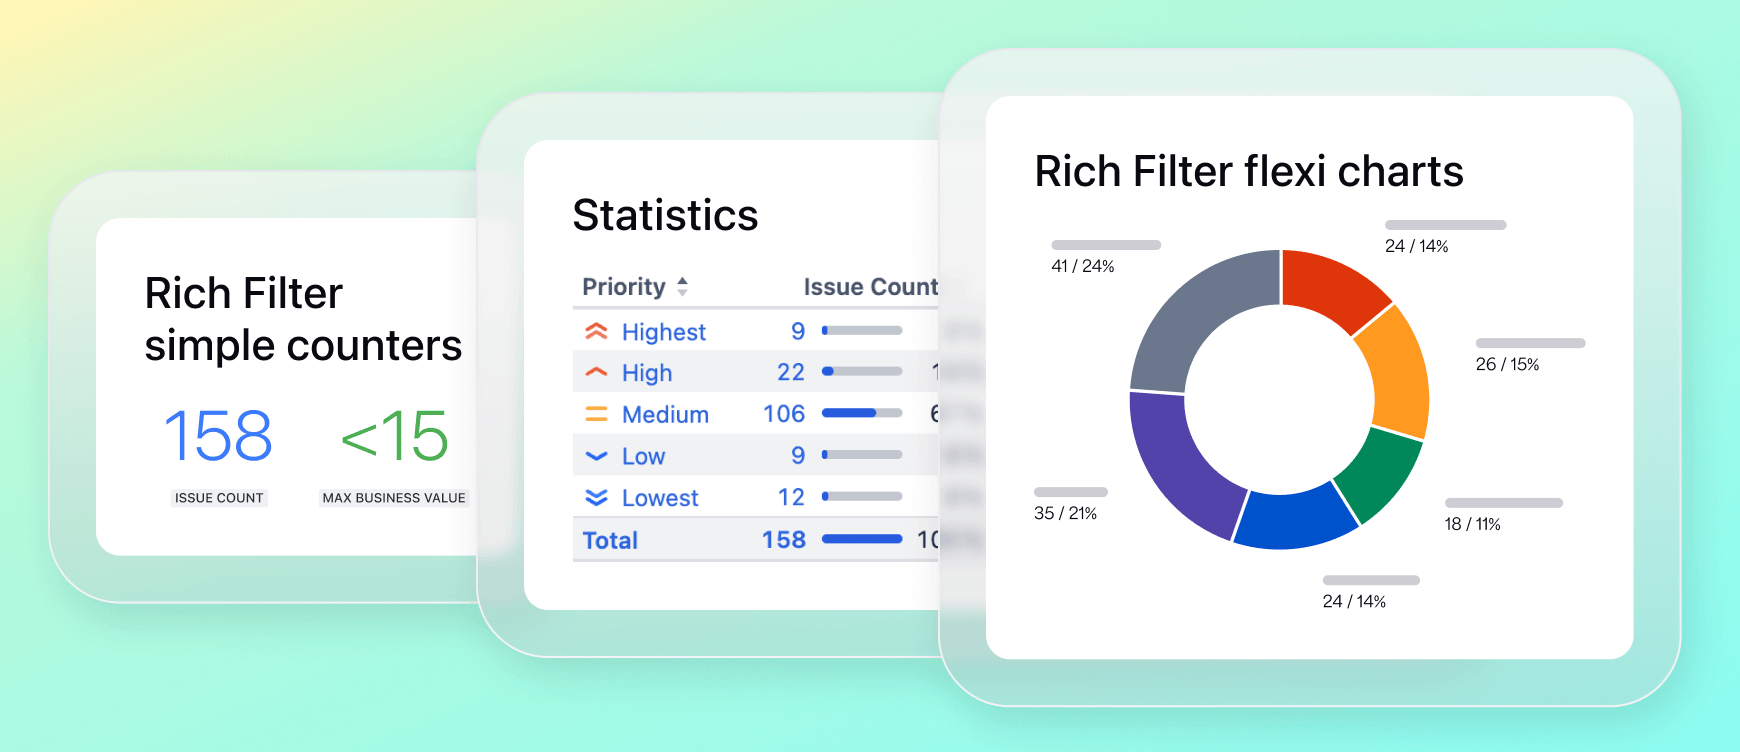
Create tailored metrics with dynamic charts and tables. Use custom fields and JQL to track Jira and JSM data and focus on the insights that matter to you.

Create tailored metrics with dynamic charts and tables.

Interact with your data

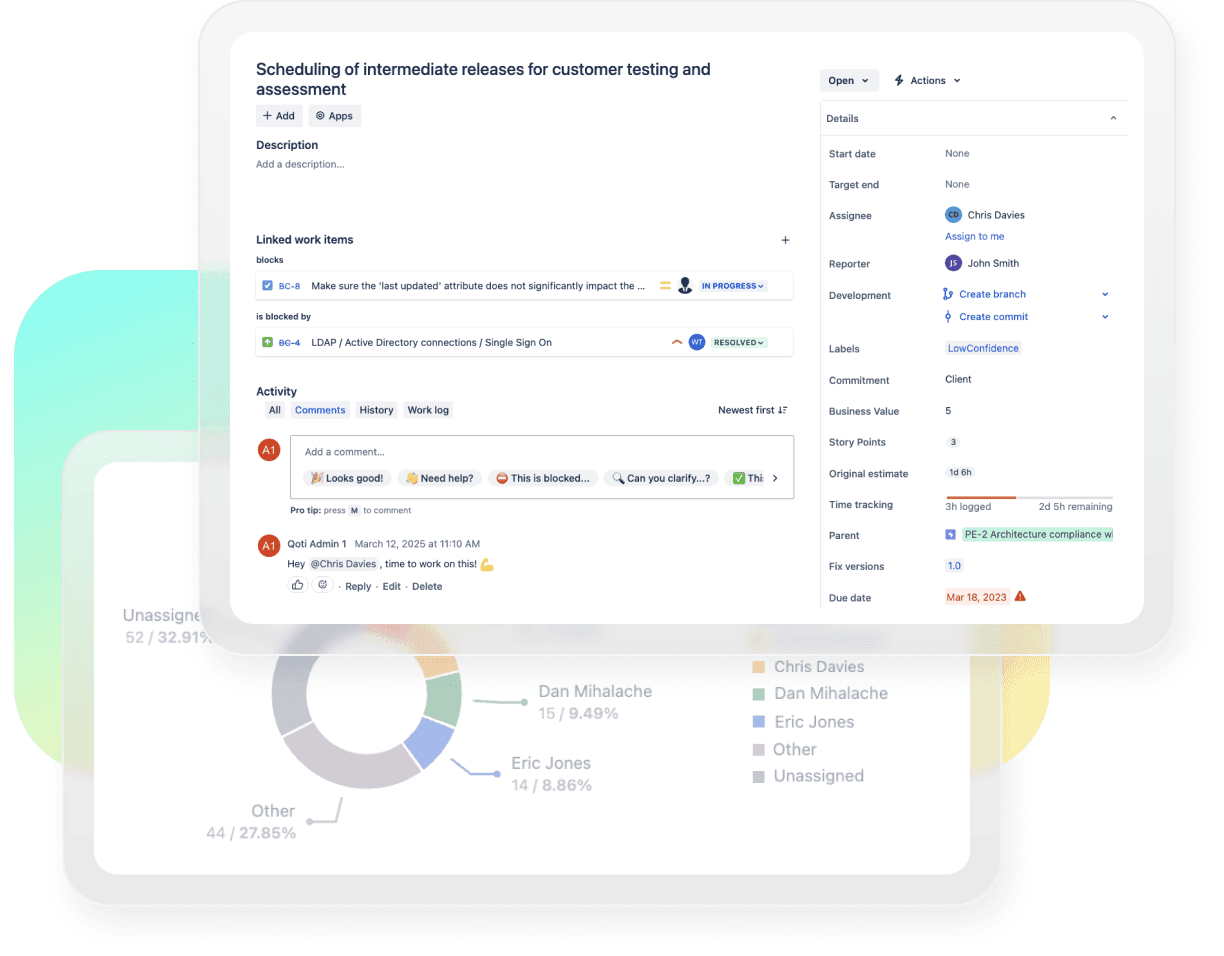
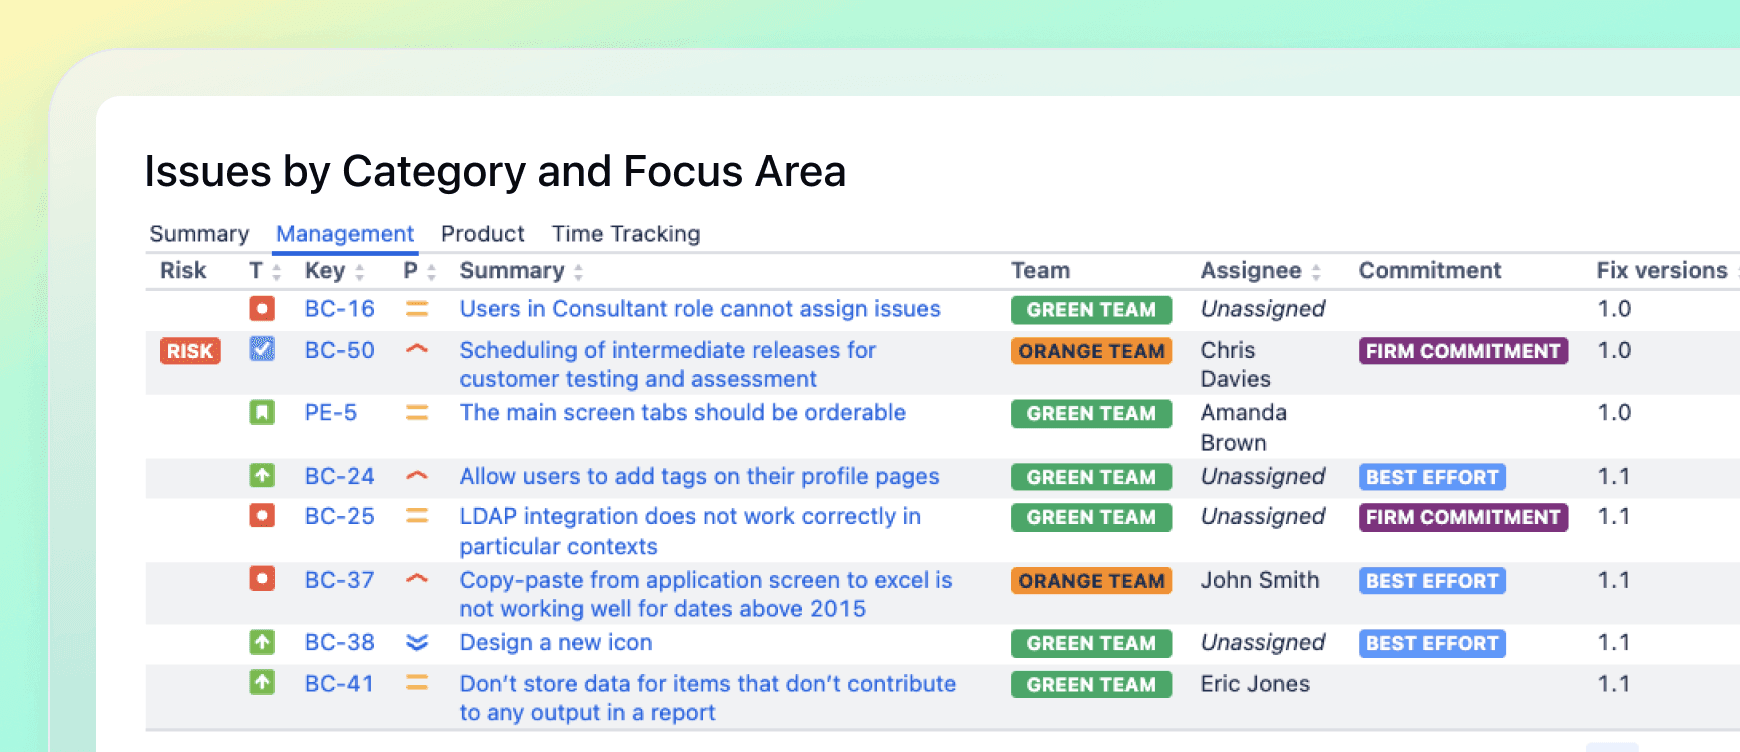
Manage issues and explore charts directly from your dashboard. Work with your data and metrics in one place to find the insights you need.

Manage issues and explore charts directly from your dashboard

Organize work your way

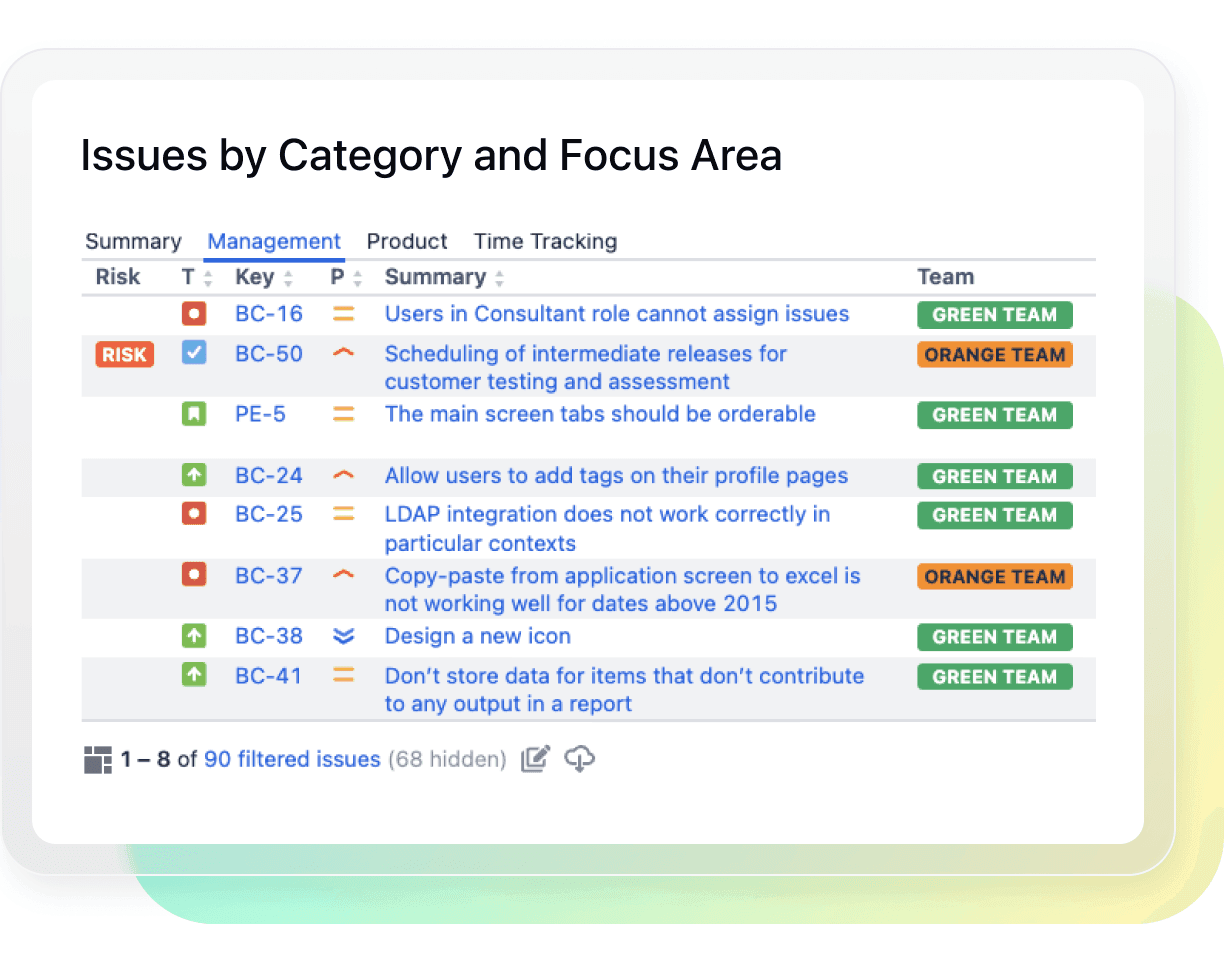
Group issues into customizable views and highlight key data with colors and tags. Make important information easier to find at a glance.

Group issues into customizable views and highlight key data with colors and tags.

How Rich Filters works 04

Make Jira dashboards work for every team

Give teams consistent ways to find relevant data, and turn one dashboard into a flexible reporting experience.

Explore features

Create a rich filter

Filter your data

Create multiple views

Build richer insights

Explore and take action
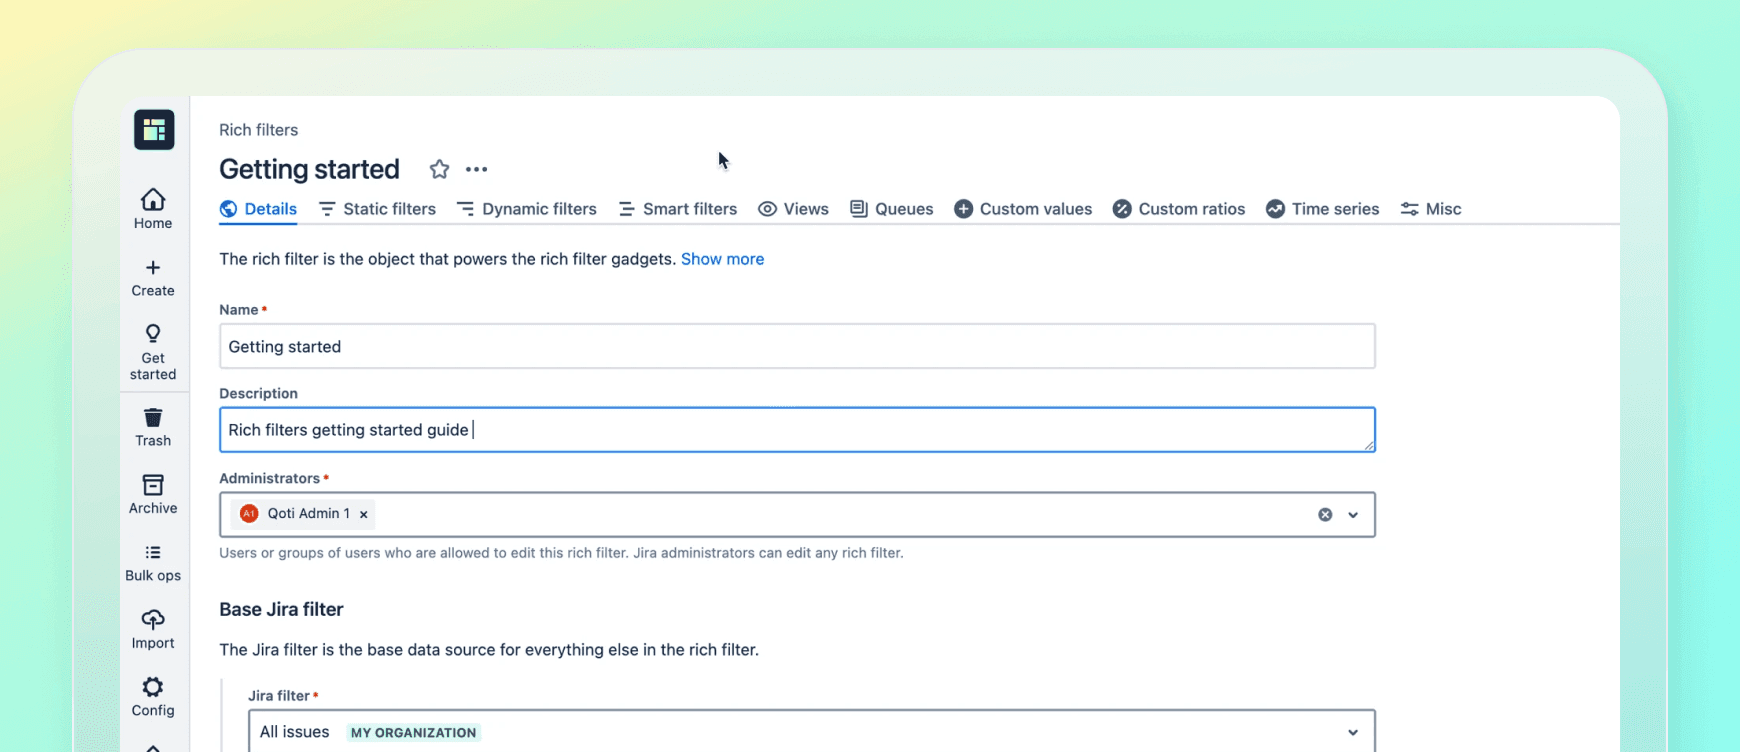
Create a rich filter to keep dashboard data consistent and easy to explore.

Start with one source of truth

Create a rich filter to keep dashboard data consistent and easy to explore.

  • Start with the Jira data you need
  • Configure filtering options
  • Reuse filters across dashboard views
  • Give teams a consistent view of the data
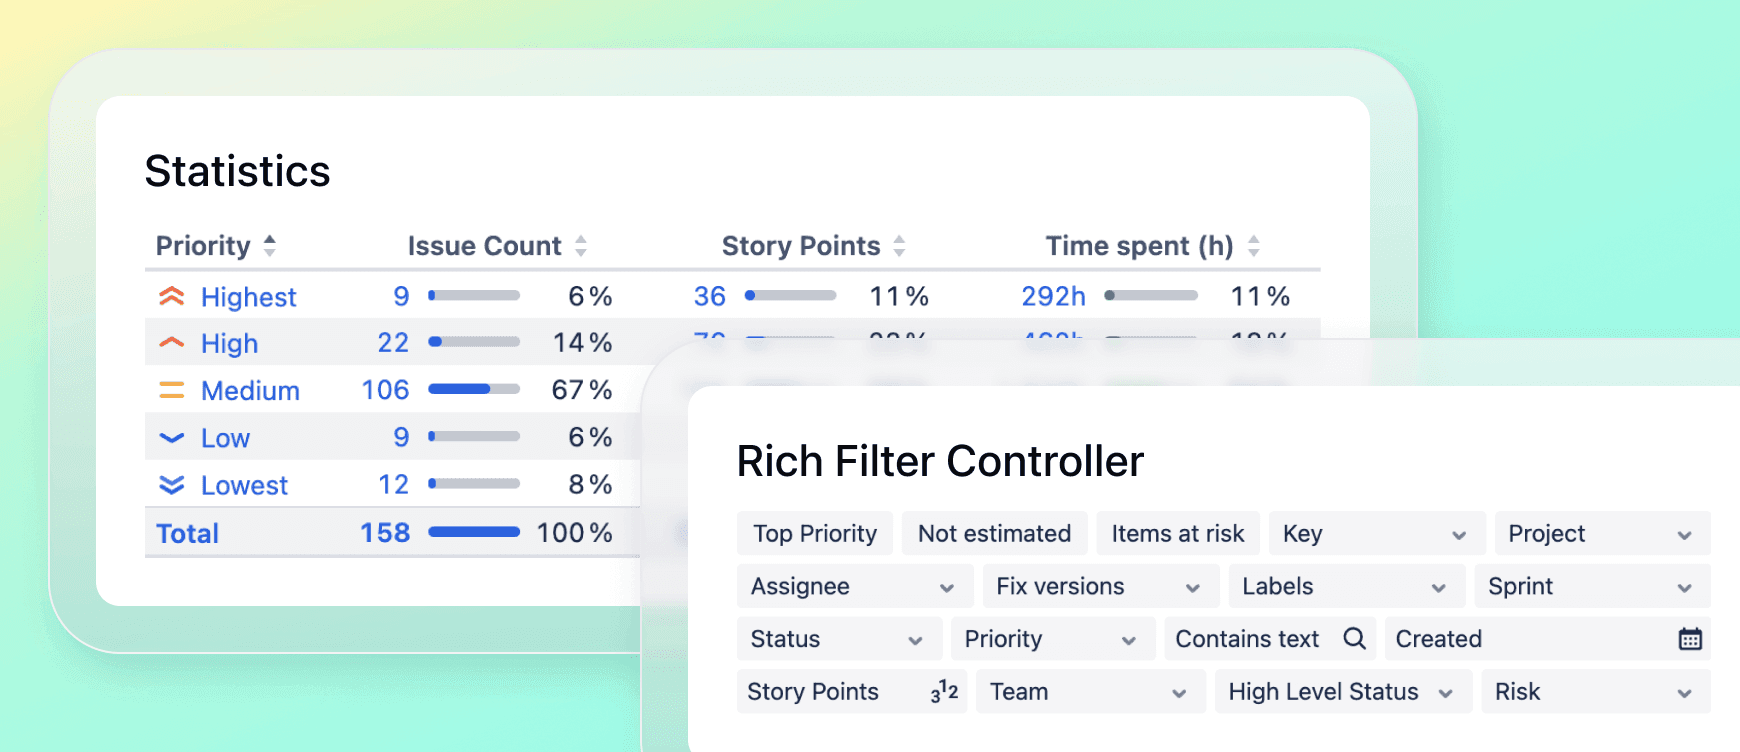
Focus your dashboard to the data that matters without building a new dashboard for every use case.

Get specific about what you see

Focus your dashboard to the data that matters without building a new dashboard for every use case.

  • Filter by project, team, status, assignee, priority, and more
  • Focus on issues that need attention
  • Narrow your view in a few clicks
Give every team the view they need from the same Jira data.

Turn one dashboard into many views

Give every team the view they need from the same Jira data.

  • Support multiple audiences
  • Create different views without duplicating dashboards
  • Reuse filterd across teams, projects, or workflows
Create charts, tables, and metrics tailored to the questions your teams need to answer.

Make Jira data easier to understand

Create charts, tables, and metrics tailored to the questions your teams need to answer.

  • Visualize the data that matters
  • Use custom fields and JQL where needed
  • Tailor metrics to different reporting requirements
  • Combine charts and tables in one dashboard
Investigate the issues behind your metrics without losing the dashboard context.

Go from insights to action

Investigate the issues behind your metrics without losing the dashboard context.

  • Explore issues directly from the dashboard
  • Move from summary data to individual work
  • Investigate what is driving results
  • Manage issues without jumping between Jira views
Quote Image

“For Atlassian admins evaluating filtering add-ons, Rich Filters is my top recommendation.

Its ability to provide immediate, scalable improvements to dashboard reporting makes it an ideal fit for any organizational size.”

Eric Lyke

Cisco

YPrime quote

“We use Rich Filters to control specific gadgets on our dashboard.

You can either highlight key data points associated with a project or client or filter down the dashboard to look for a more holistic view of a specific client or project.”

Paulo L.

YPrime, pharmaceutical, 400 employees, United States

“This app is critical for our organization. It provides powerful and beautiful dashboards that provide key insights into our agile teams and workload. It's a game changer, eliminating the need for other reporting tools.”

Stacy Z.

“We have been using Rich Filters for as long as we've been using Jira and I can't imagine using Jira without Rich Filters.”

Lionel C.

“Rich Filters changed the way we work in Jira.”

Cudi Ü.

Supporting apps 05

Get full visibility and control over your Jira data

Rich Filters logo

BigPicture

Combine project and portfolio planning views with Rich Filters to give teams more context when exploring Jira data.

Learn more

Dashboard Hub Pro

Bring Dashboard Hub pre-defined metrics and external product integrations into your Rich Filter dashboards.

Learn more

Time to SLA

Use SLA-related Jira data alongside filtered dashboards to help teams focus on service performance and work that needs attention.

Learn more

App comparison 06

Compare Jira dashboard options for reporting

See how Rich Filters for Jira Dashboards compares to other reporting tools and why it delivers faster insights, smarter filtering, and flexible views your teams will actually use.

Feature

Rich Filters Dashboards

Built-in Jira dashboards

Custom Charts for Jira

eazyBI Reports/Charts

Initial setup and user interface

IntuitiveIntuitiveIntuitiveTechnical

Advanced charting and metrics

JQL filtering with buttons

Less intuitive

Dynamic filtering by field

Less intuitive

Smart filtering (JQL dropdowns)

Partial coverageRequires report setup

Interactive issue list and views

Non-interactive listAnalytical reporting focus

Edit issues directly on dashboard

Rich Filters Dashboards

Built-in Jira dashboards

Custom Charts for Jira

eazyBI Reports/Charts

Initial setup and user interface

Intuitive

Advanced charting and metrics

JQL filtering with buttons

Dynamic filtering by field

Smart filtering (JQL dropdowns)

Interactive issue list and views

Edit issues directly on dashboard

Comparison based on publicly available information and internal testing as of Dec 1, 2025. Features and functionality may vary by product version, configuration, and pricing tier. We recommend evaluating each solution based on your specific requirements. Product names are trademarks of their respective owners.

FAQ's 08

FAQ's

Rich Filters for Jira Dashboards turns Jira dashboards into flexible, interactive reporting spaces. Filter data, create tailored views, explore issues, and use charts and metrics to understand your work from different angles.

A rich filter adds more flexibility to an existing Jira filter. It lets you control how dashboard data is filtered, displayed, highlighted, and explored.

Create focused views of your Jira data, add filtering options, highlight important information, and visualize results in interactive dashboards. You can give different teams and roles the views they need without creating separate reporting experience.

Yes. You can create multiple views of the same Jira data for different teams, roles, or use cases without maintaining a separate dashboard for every variation.

Rich Filters supports several ways to filter Jira data, including static filters that apply JQL, dynamic filters based on Jira fields, and smart filters that present JQL options in dropdowns. Users can quickly narrow down dashboard data to find the information they need.

A basic understanding of Jira Query Language (JQL) is helpful when setting up rich filters, especially for advanced filtering. Once the dashboard is configured, users can apply the available filters without writing JQL.

Yes. Rich Filters includes several gadgets for visualizing and analyzing Jira data through charts, gauges, statistics, and metrics. You can tailor your reporting further using Jira fields and calculations.

Yes. Rich Filters includes an interactive results view that lets you explore Jira issue directly from your dashboard. You can also sort results to find relevant information faster.

Yes. Rich Filters for Jira Dashboards for Cloud is available to try free for 30 days.