

An engineer opens a pull request. The code looks right — mostly. It compiles, it passes the basic checks, but on closer reflection, something's off. Or something feels off. They can’t name it, but the code doesn’t sit right. So they dig in, trace the logic, and spend the next hour fixing what the AI got almost correct.
When AI gets it wrong, there’s no stack trace for misplaced logic. Instead, you’re hunting through code you didn’t write in patterns you didn’t choose, trying to find a fault that may not be obvious once you find it. And according to new survey data, it's happening across engineering organizations everywhere.
AI has moved faster than most engineering teams expected — and faster than most of them were ready to manage. In just a few years, it's gone from a tool individual developers experimented with on the side to infrastructure that entire engineering organizations depend on.
The rollout didn't wait for governance frameworks or measurement playbooks to catch up. Adoption happened one team and tool at a time. Now, most engineering organizations are running AI at scale and figuring out the management problem in real time.
Appfire surveyed over 350 U.S.-based IT managers and senior leaders involved in software engineering to look at where AI is being used, what results leaders are actually seeing, how they're measuring success, and what's still getting in the way.
97% of engineering leaders report at least moderate AI adoption at their organizations. 93% say they're confident AI is delivering measurable ROI. But 68% of teams spend at least 4 hours a week reviewing or correcting AI output — and more than a quarter spend 8 hours or more. 86% report at least one significant obstacle to scaling it. Most teams are confident that AI is adding value, but there's a clear disconnect. Many teams lose a portion of that value correcting AI outputs.
Key takeaways
- 97% of engineering leaders report at least moderate AI adoption as of Q1 2026
- 93% say AI has improved code quality, with 45% reporting significant improvement — yet most teams aren't tracking the review time required to get there
- 93% are confident AI is delivering measurable ROI, yet 54% still cite data privacy and security as their top obstacle to scaling it
- 68% of teams spend at least four hours per week reviewing or correcting AI output, a cost that doesn't show up in most productivity dashboards
- Code generation and code review lead AI use cases at 63% each. Process automation has nearly caught up at 60%, a sign that AI is becoming an operational layer, not just a developer tool
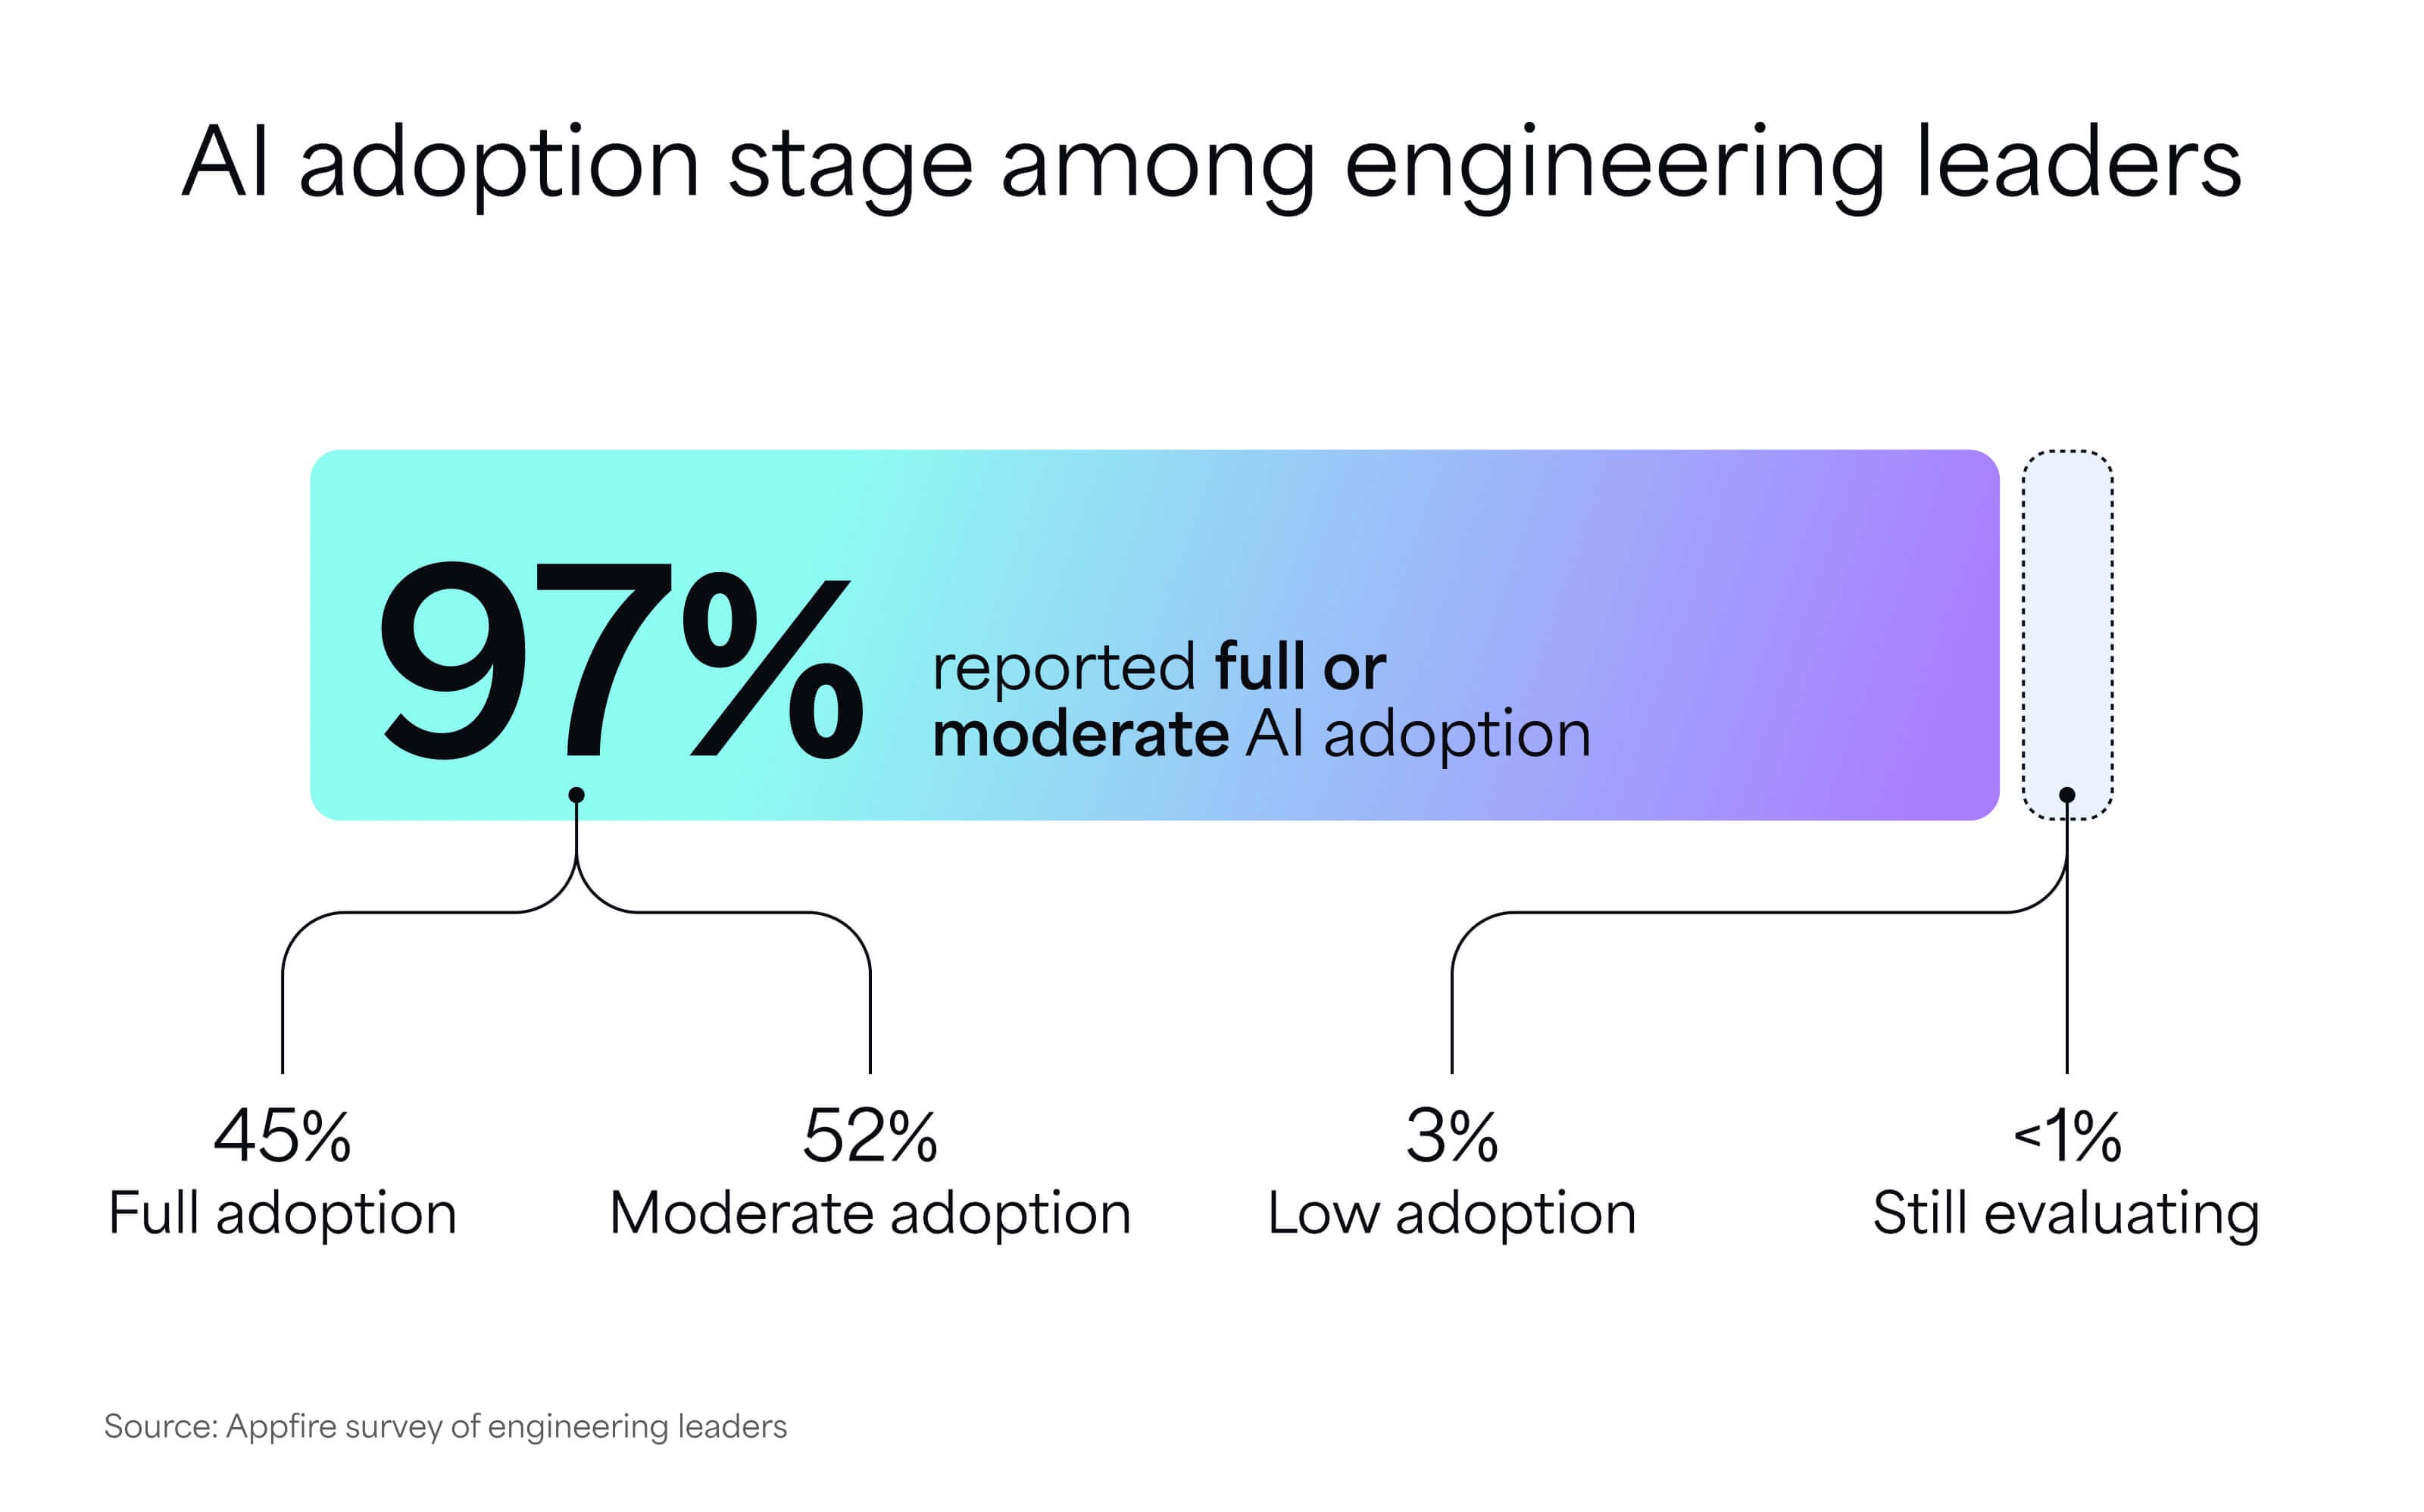
97% of engineering teams have already adopted AI
97% of engineering teams report full or moderate AI adoption. 45% say AI is fully integrated across workflows, and just over half are in active rollout across development teams. Most aren't just deploying tools either. Three in four have formal training programs or workshops in place to help teams adapt to AI-driven development workflows, which means the investment is going deeper than tooling.
AI tools are no longer an early-adopter story. For most engineering organizations, adoption is the starting point. The harder question leaders are navigating now is how to scale something that's already running, and whether it's actually working.
93% of leaders say AI is making their code better
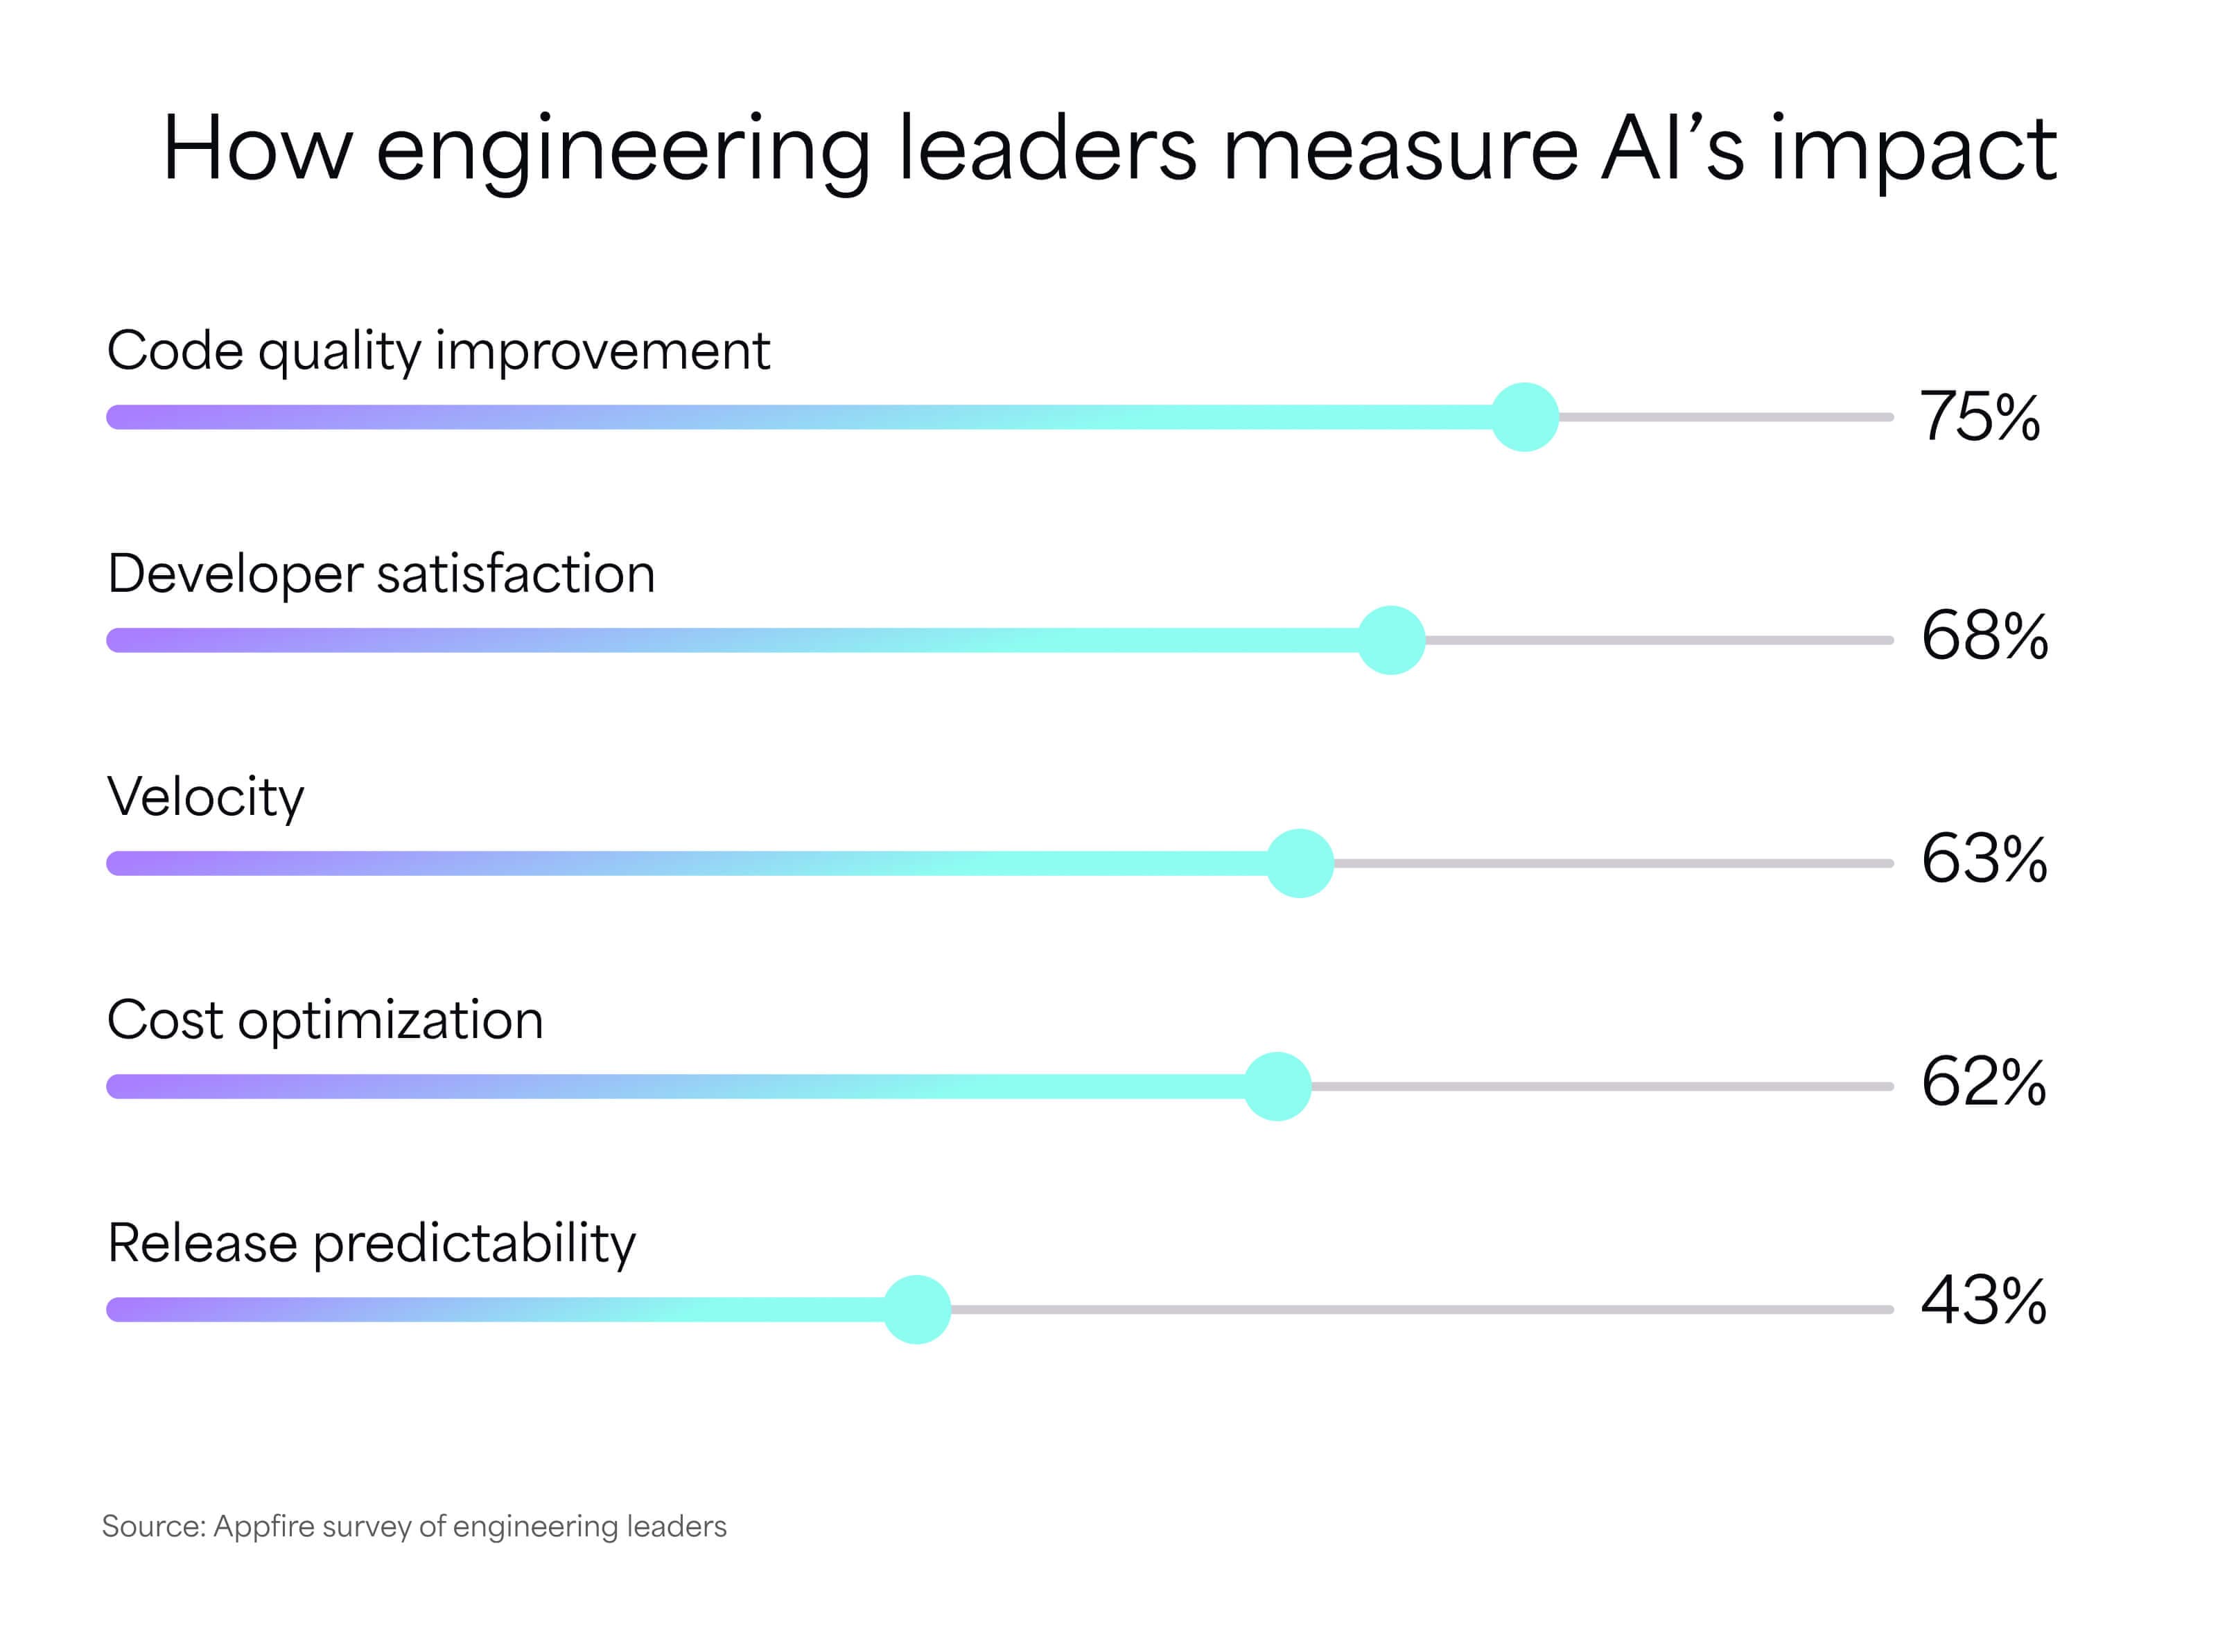
93% of engineering leaders say AI has improved their team's code quality, with 45% reporting significant improvement and 48% reporting moderate improvement.
Leaders are tracking that improvement across five metrics — code quality, developer satisfaction, velocity, cost optimization, and release predictability.
These aren't new metrics; engineering professionals have used both automated tools and human gut checks to test them for a long time. Just as experienced developers review a junior’s work, engineers are now reviewing AI outputs with a critical eye or running them through a separate AI tool to make sure the code is functional.
When using AI tools, a low defect rate may look like quality work, but engineers may be wasting hours reviewing AI-generated PRs before they ever reach a reviewer. This overhead doesn’t appear on any standard dashboard, creating a continuous, hidden cost.
How those metrics relate to each other is where things get interesting.
The most thoughtful engineering leaders are framing AI success more broadly than speed — quality and satisfaction both rank above velocity, which suggests the goal is better work, not just faster delivery.
But "quality" is doing a lot of work here, and it's worth asking what it actually means in practice. Fewer bugs? Faster iteration? Cleaner code that's easier to maintain? Most teams aren't measuring all three separately — and that matters when you look at what the data shows beyond that.
Better code quality and high review overhead can coexist, but it means quality isn't free. Someone is doing the work to make AI's output usable. That's worth tracking alongside developer productivity metrics, not separate from them.
Velocity and review overhead don't move in the same direction, and this metrics list doesn't account for that tension. Release predictability, which ranked lowest at 43%, is the metric that's hardest to game and most directly tied to delivery confidence. The teams tracking it most seriously tend to be the ones who understand that DevOps best practices require the full picture, not just the headline numbers.
68% of teams spend 4+ hours a week correcting or reviewing AI output
68% of engineering teams spend at least 4 hours per week reviewing or correcting AI-generated output — and that's the number most productivity dashboards aren't capturing.
In a 40-hour engineering week, a developer spending 8 hours on AI review is giving up a fifth of their capacity to validation work. Multiply that across a team of 50 engineers, and you're looking at hundreds of hours a month that don't show up in sprint velocity, cycle time, or throughput reports.
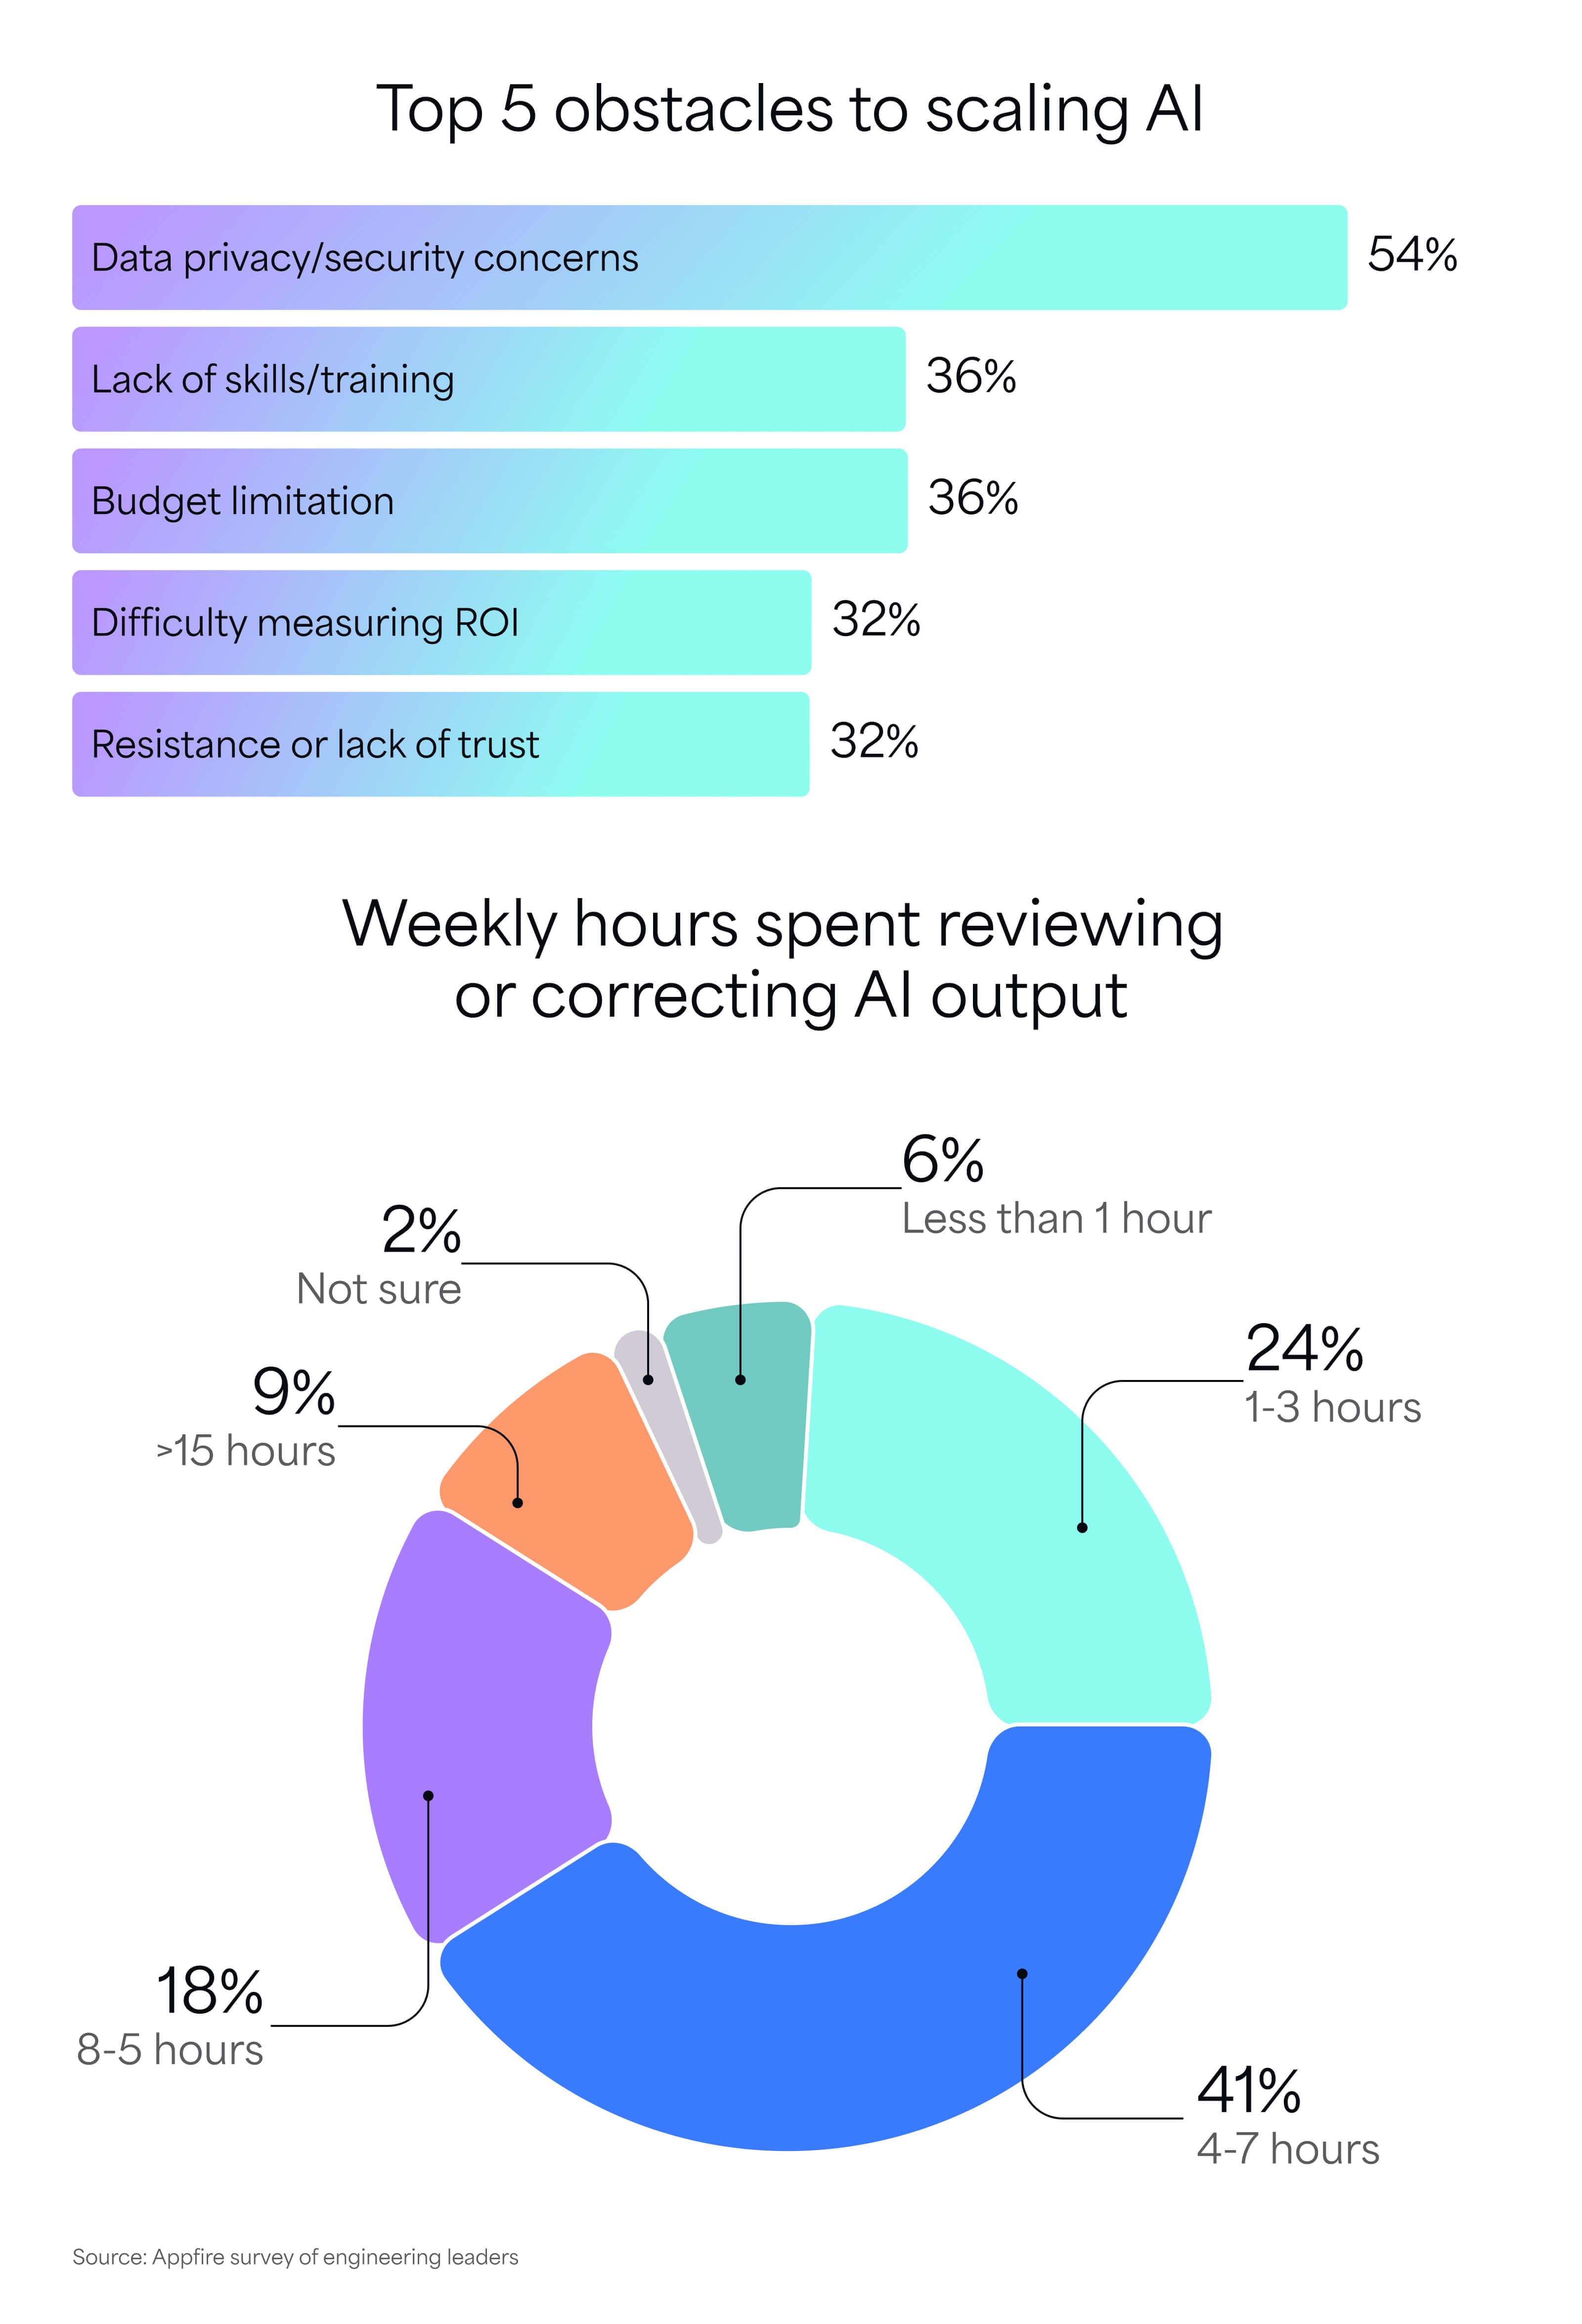
That invisibility is where the ROI story gets complicated. 93% of leaders say they're confident AI is delivering measurable returns — but if engineers are spending 4–15 hours a week validating AI output, the net productivity gain is smaller than the ROI numbers suggest.
Confidence in ROI and accurate ROI measurement aren't the same thing. And right now, most organizations are working from incomplete inputs. Tightening the code review process has always been high-leverage, but it's getting harder to manage as AI-generated PRs become the norm and review volume climbs.
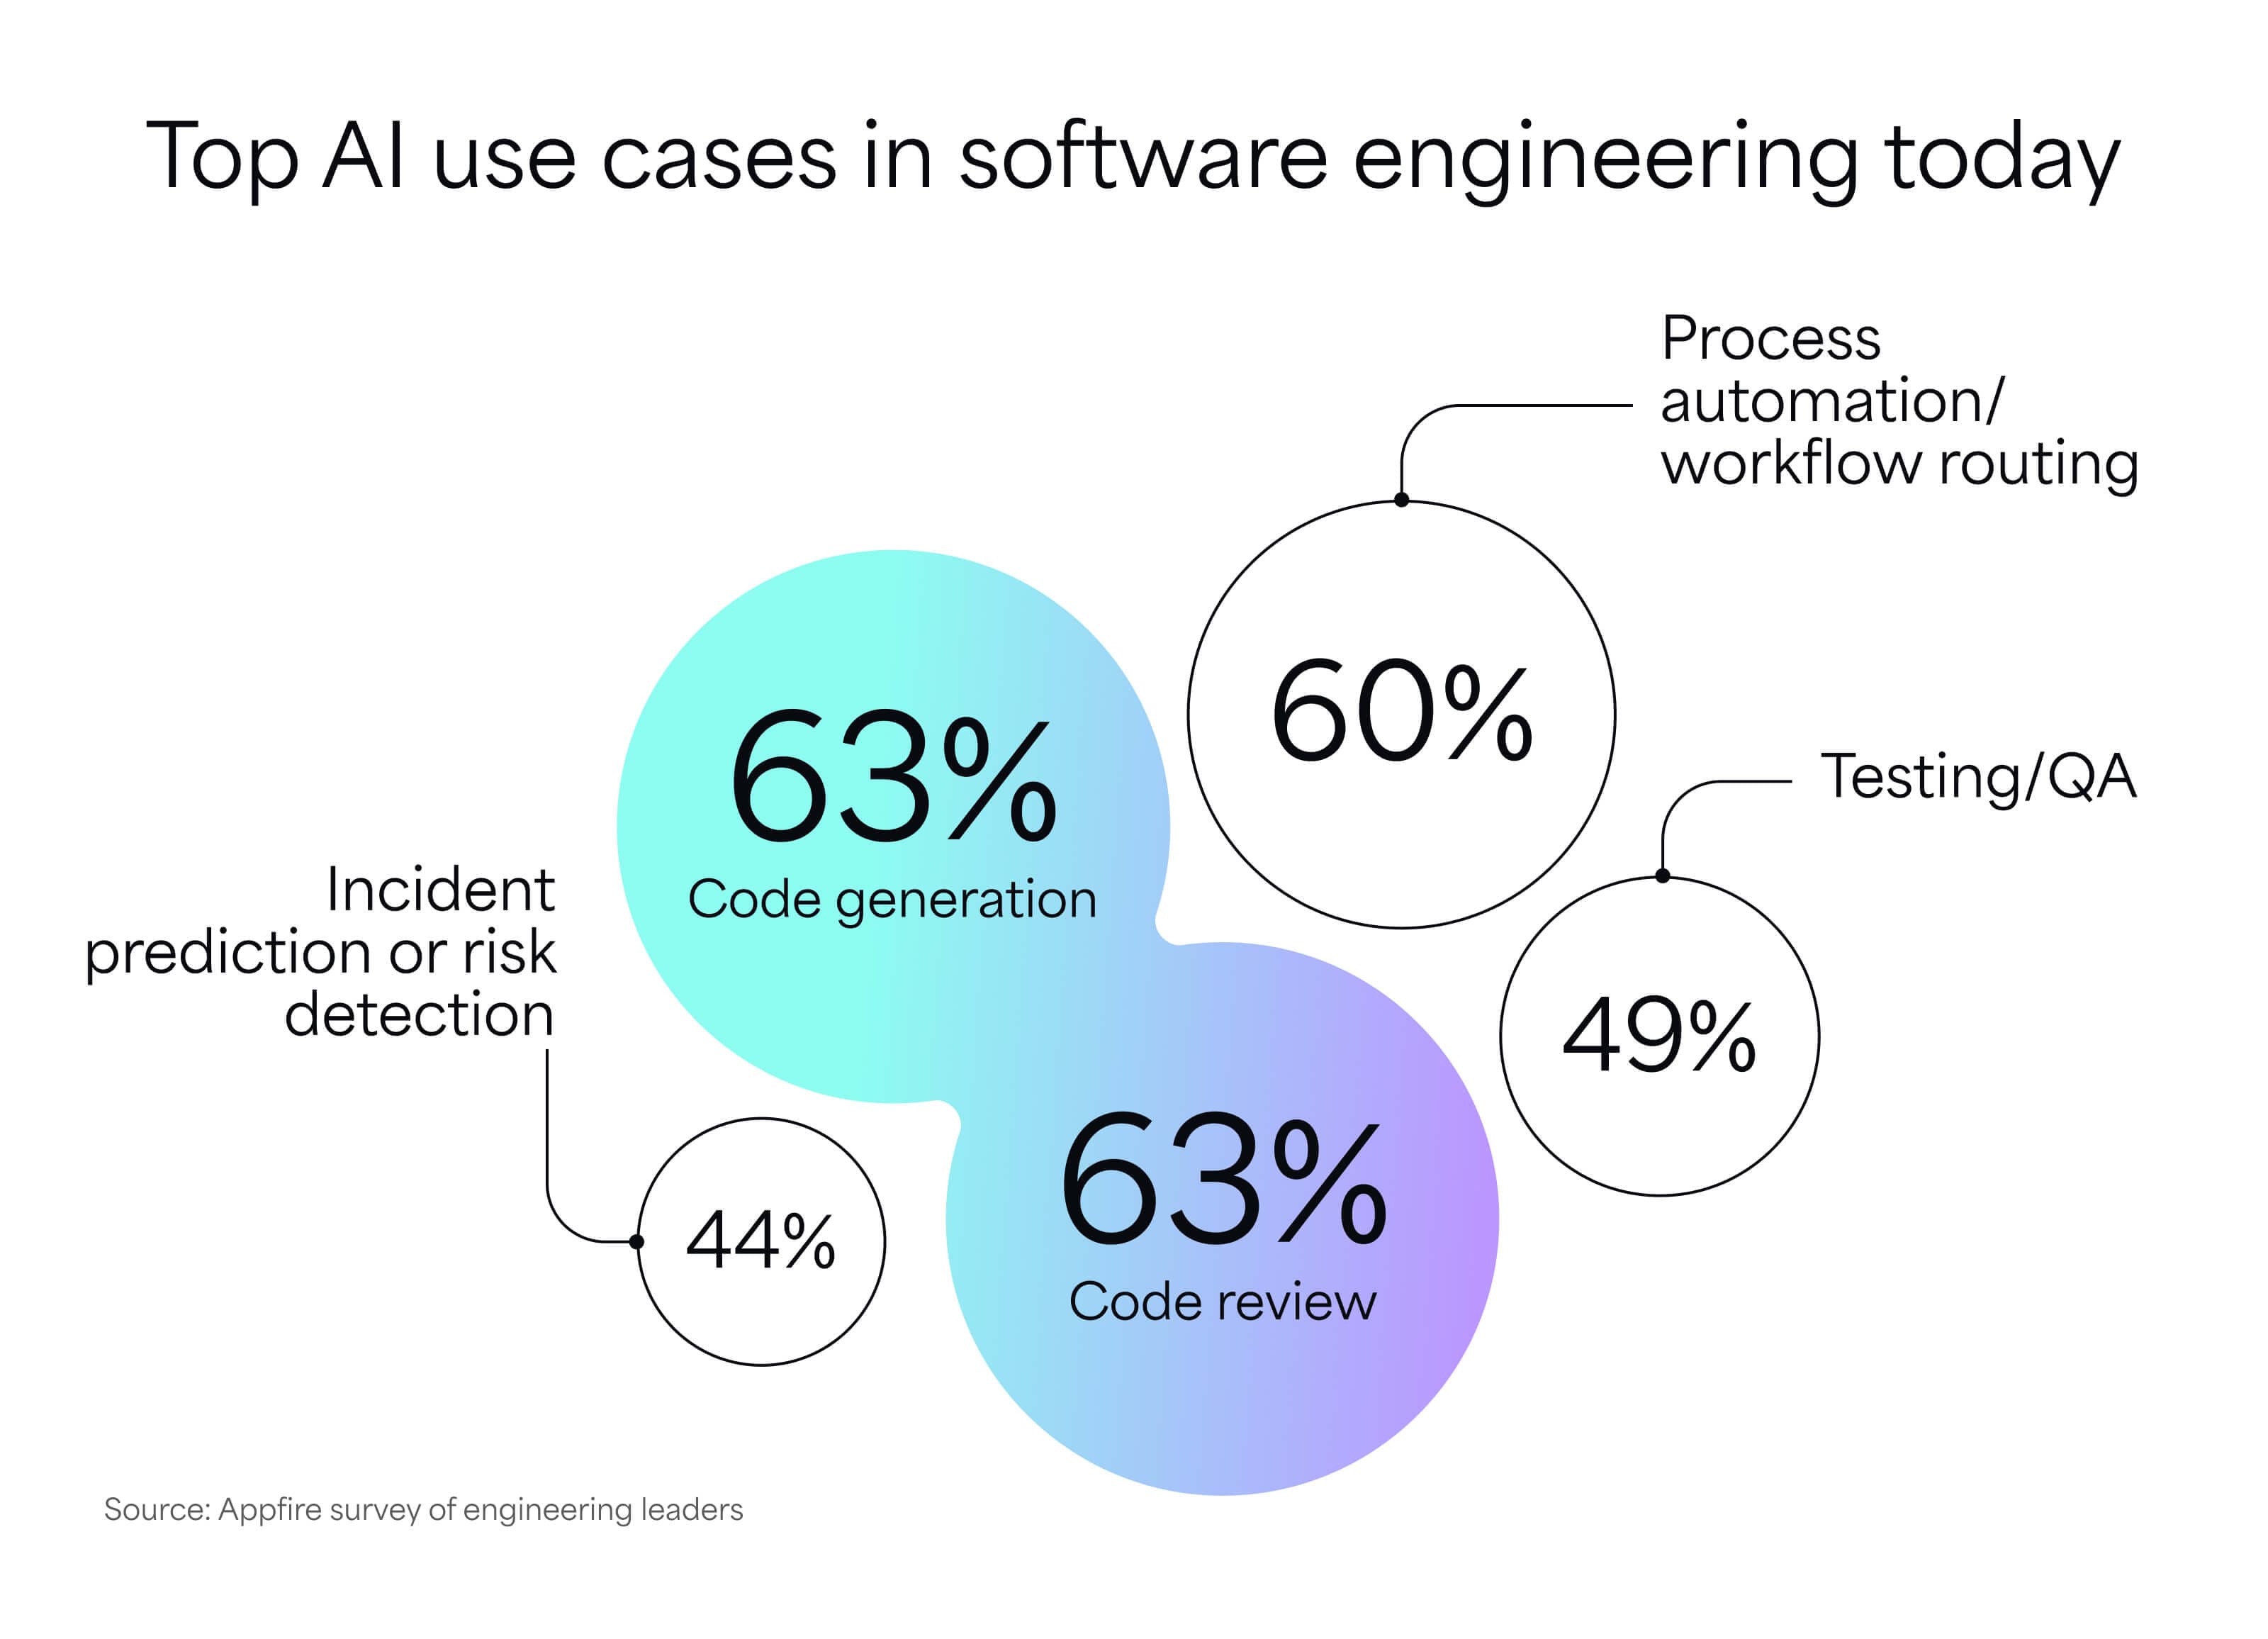
Process automation has nearly caught up with code generation as a primary AI use case
Code generation (63%) and code review (63%) lead the list of AI use cases today. But process automation and workflow routing have nearly caught up (60%).
That near-parity shows a shift: AI has moved beyond the IDE. It's now an operational layer across every step of the SDLC — embedded in how work gets routed, prioritized, reviewed, and shipped. Testing, QA, incident prediction, and risk detection are now part of that operational footprint. AI is increasingly becoming a foundational tool that engineers use to do their job.
The operational focus changes who owns the problem. When AI spans planning, review, testing, and release workflows, engineering leadership must decide how to govern these outputs –– not just deploy them. The entire team is affected, and the DevOps metrics teams rely on need to reflect where AI is actually operating, or they're measuring an older version of the pipeline.
86% of engineering leaders report at least one obstacle to scaling AI
Even with near-universal adoption, 54% of leaders cite data privacy and security concerns as a top barrier to scaling. Lack of skills, budget limitations, and difficulty measuring ROI each land around 32–36%. Nearly a third (32%) report resistance or lack of trust from their own teams.
These are scaling obstacles, not launch problems. Each affects delivery in a specific way.
For example, skill gaps, thanks in part to AI fast-tracking juniors to senior levels, leave them without the same level of judgment. They lean hard into what the AI gives them without really understanding the implications of the low-quality code it spits out.
Still, AI is embedded and producing results, and most leaders believe in it. But correcting output, closing skills gaps, and navigating privacy requirements all carry costs that most teams are absorbing without a clear strategy to measure or reduce them.
Because AI still requires validation, senior engineers are spending time reviewing and correcting AI outputs, time that could be better spent tackling more complex problems or high-value engineering work. Until review time shows up in the same reporting layer as delivery metrics, the business case for AI will keep overstating the gain.
What this means for engineering teams right now
AI has become a foundational part of software development — the adoption numbers and ROI confidence make that clear. But proving the tool and scaling it responsibly are different problems, and most organizations are still working out the second one.
Based on what the data shows, here’s what teams should do differently:
Think of AI as a low-level engineer. Continuously review AI outputs and train staff on how to use AI to minimize mistakes. Importantly, you should understand how much time staff are spending editing AI outputs. If a junior developer's basic mistakes were causing more work for the rest of your team, you would want to course-correct to make sure the employee is on track. AI's no different.
Treat skill gaps as a delivery risk. When junior developers over-rely on AI outputs, they don’t fully understand them, and seniors end up absorbing the correction work. That’s a capacity problem that compounds over time. Ignoring this leaves the teams to build their own review checkpoints, slowing your delivery speed.
Expand on what ROI means. Confidence in AI’s value is high, but most teams are measuring output volume metrics like lines of code (LOC), tickets closed, and PRs merged. The true half of this is the correction overhead, meaning review time and the hidden cost of outputs that passed review and failed in production. Know both sides of the equation so you’re not overconfident in your dashboard’s estimated ROI.
The teams getting the most from AI aren't necessarily the ones who adopted it earliest. They're the ones tracking review and correction time as a real delivery metric, evaluating impact across quality, satisfaction, and predictability — not just velocity — and treating AI as a process change rather than a procurement decision.
Appfire Flow connects data across Jira, GitHub, GitLab, and Azure DevOps to give engineering leaders a clear view of how delivery is actually performing — including the overhead that traditional reporting misses. See it in action.
Methodology
Conducted by Centiment for Appfire, the survey was fielded in March 2026. The results are based on 361 completed surveys. In order to qualify, respondents were screened to be individuals employed in IT with a title of manager or higher who are involved in software engineering at their organization. Data is unweighted, and the margin of error is approximately +/-3% for the overall sample with a 95% confidence level.
Try Appfire Flow for free