

Can Jira do portfolio management? Managing project portfolios is not something Jira is most suitable for. But it does not mean you cannot perform portfolio-related processes while having Jira already in use in your organization. With BigPicture—a powerful Jira portfolio plugin—you can easily build and successfully manage your project portfolios, no matter how big or complex they are.
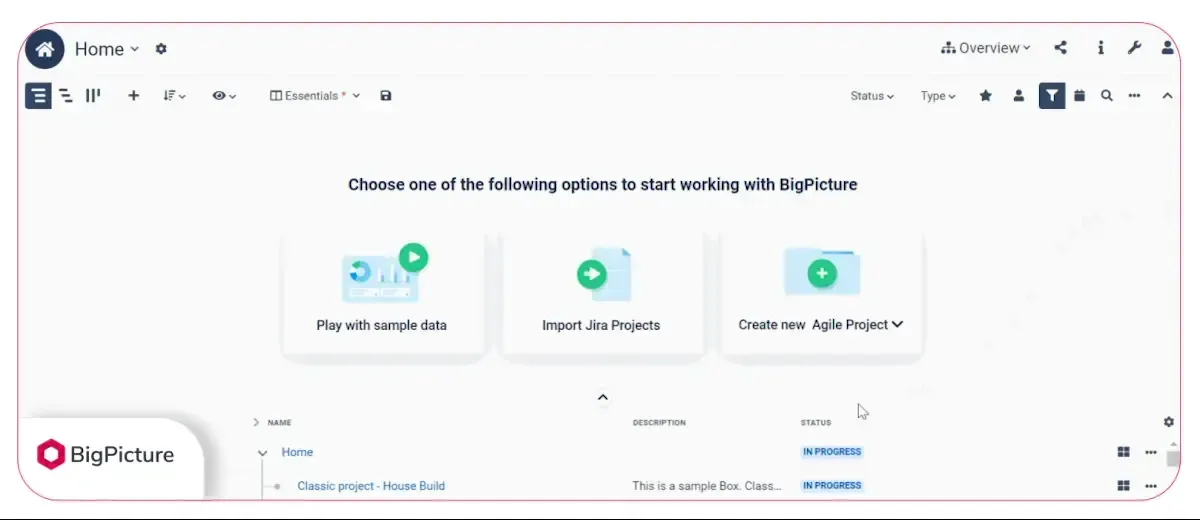
Try BigPicture for free(If you are not ready to start the 30-day trial yet, we encourage you to visit our demo page, where you can try all the BigPicture features. The demo app runs inside the browser, so you do not need to install anything or create an account).
1. Build the structure of your Jira portfolio
“Portfolio” is an umbrella term for a collection of projects, programs, and processes that portfolio managers manage and optimize together. You can visualize it as a diagram or a tree-like structure, where the most overarching element—the total project portfolio—is the root.
It is possible to group projects or initiatives into sub-clusters and also term them as portfolios, even though technically, they would be positioned somewhere at lower levels in relation to the “root portfolio.”
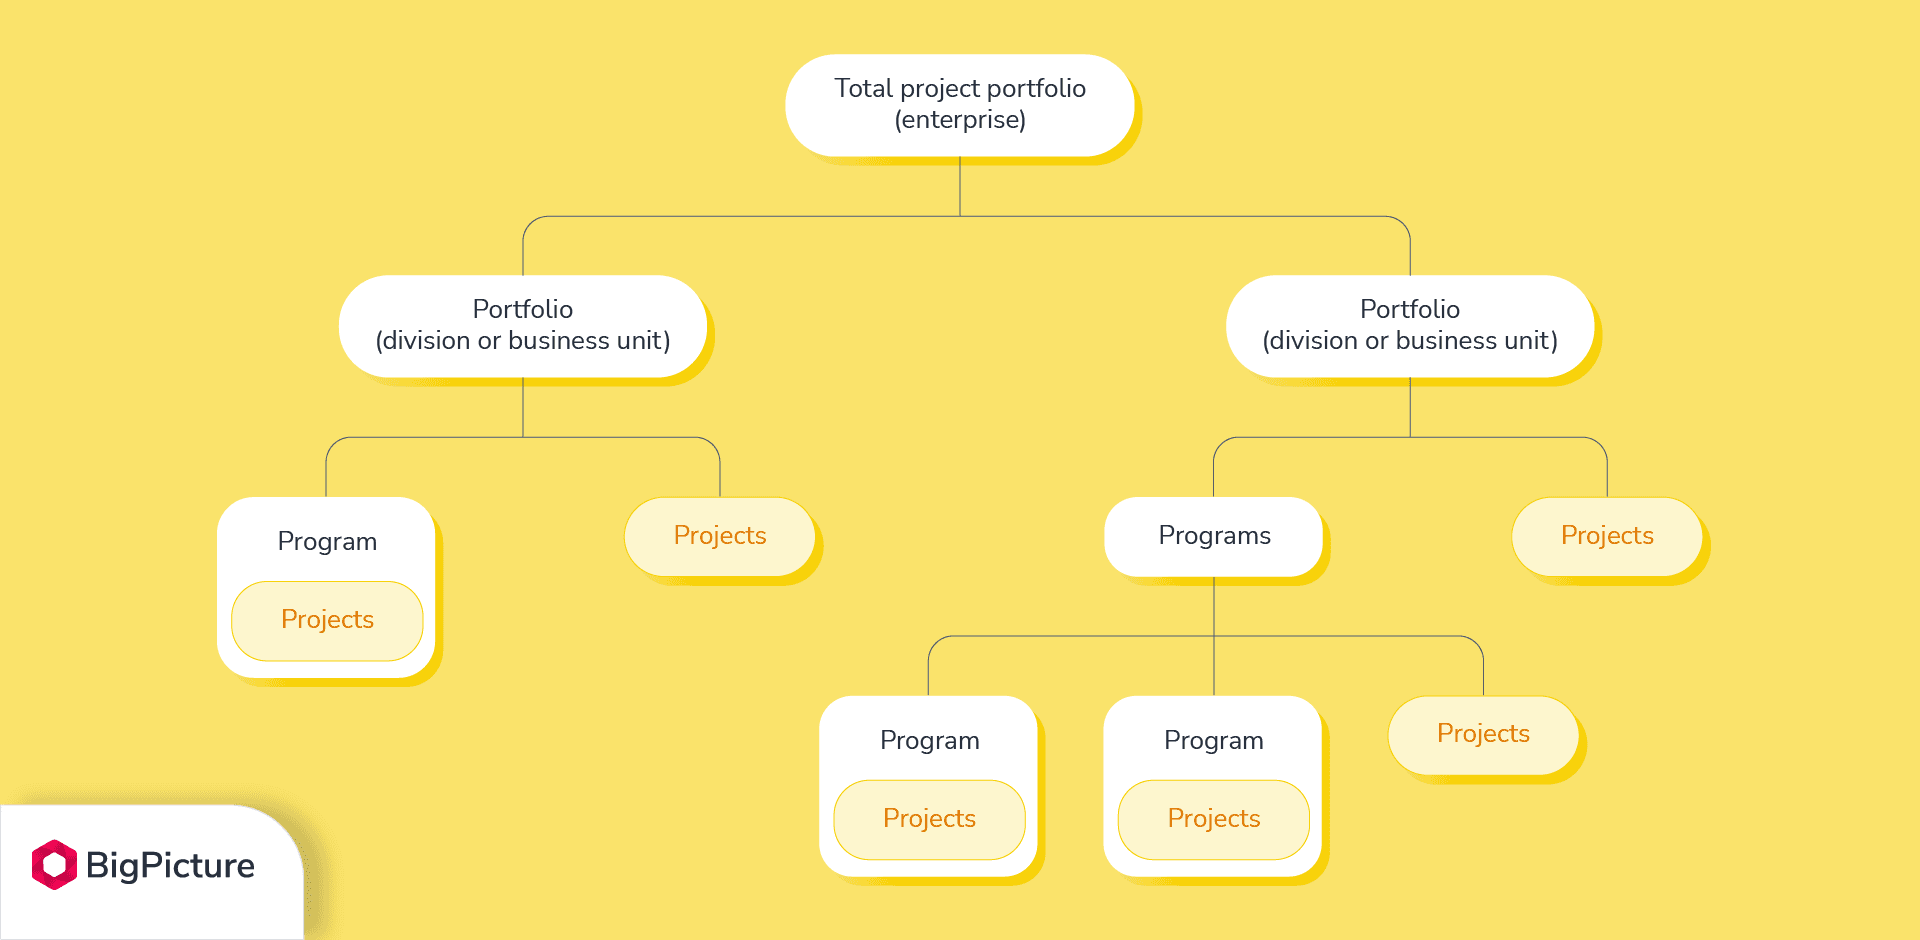
You can create a similar or even much bigger and more complex portfolio structure in Jira with the help of BigPicture.
Organize your initiatives with templates
Projects, programs, and SAFe® epics—they all can fall under your portfolio. Therefore, you need to have a way of distinguishing and building relationships between each initiative you can have.
BigPicture app offers a wide selection of so-called initiative templates (Box Types). They are the preconfigured templates for different types of initiatives (or other pieces of work) you can use for your existing and new Jira projects. These include agile, classic, and hybrid projects, as well as increments, Sprints, SAFe® ARTs, and more. If your initiative is unique, you can create a custom template and configure it to suit your needs.
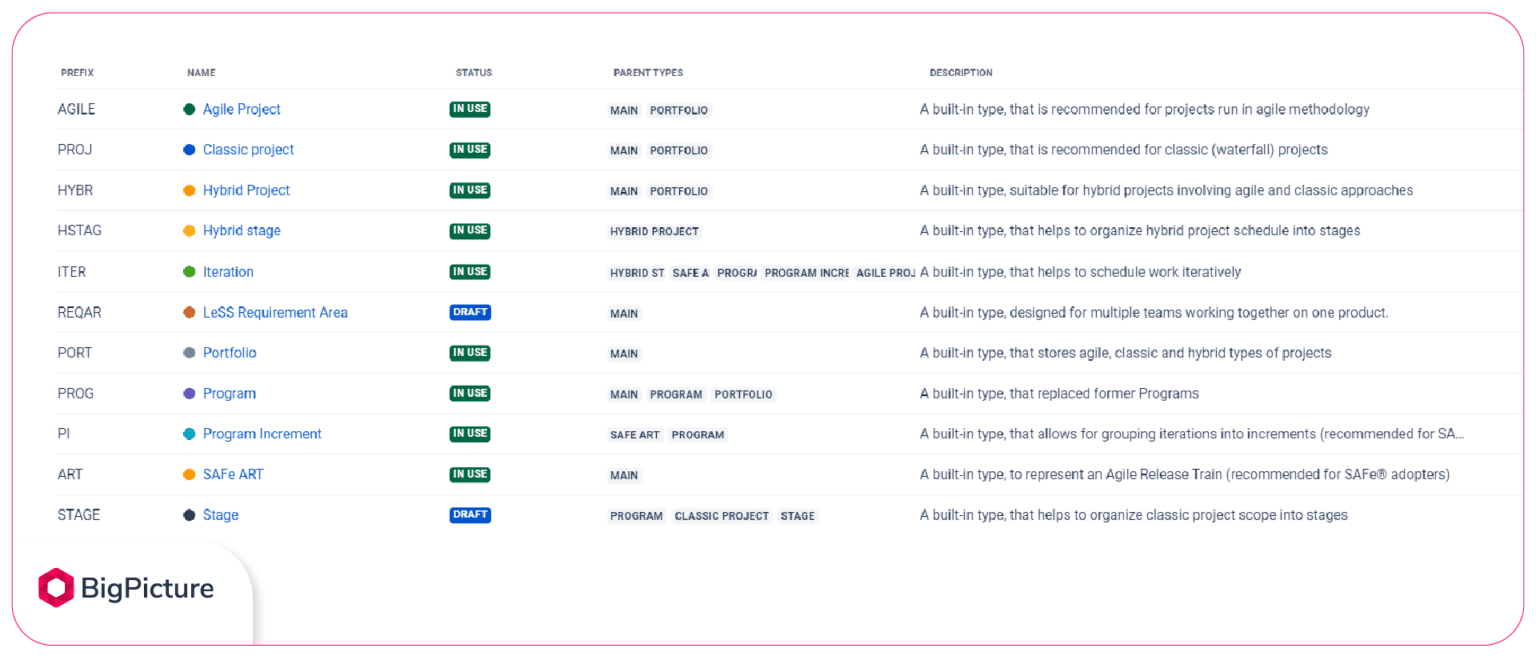
Templates will help you start working on your projects faster. They will also let you create parent-child relationships between individual portfolio items and prevent mixing different methodologies together.
For example, you can use SAFe® ART templates to group Program Increments; or a Portfolio type to nest agile, classic, and hybrid projects under it. There is no limit as to how many children one parent element can have.
Tip: If any of the initiative type namings does not fit your project or follow the nomenclature you use in your organization, you can change it for each template type. BigPicture supports the non-Latin alphabet, so you can rename the templates in any language.
See also: How to use Gantt as a roadmapping tool? (video)
Give your portfolio a shape
Since a project portfolio should follow a hierarchical structure, our portfolio plugin for Jira lets you move individual children and parent elements up and down with a convenient drag-and-drop feature.
However, please keep in mind that by default, not every child is compatible with every parent. It means that, for example, you cannot move a SAFe® ART initiative under the portfolio parent because it is not the default parent for this type of initiative.
But don’t worry—you can customize each template and add more parent types. This way, you can create more nesting combinations for your Jira portfolio than is allowed by default. What will happen when you try to make an “illegal” nesting? Jira portfolio plugin will prompt you with an error message saying that you cannot move a given sub-element to a given parent.
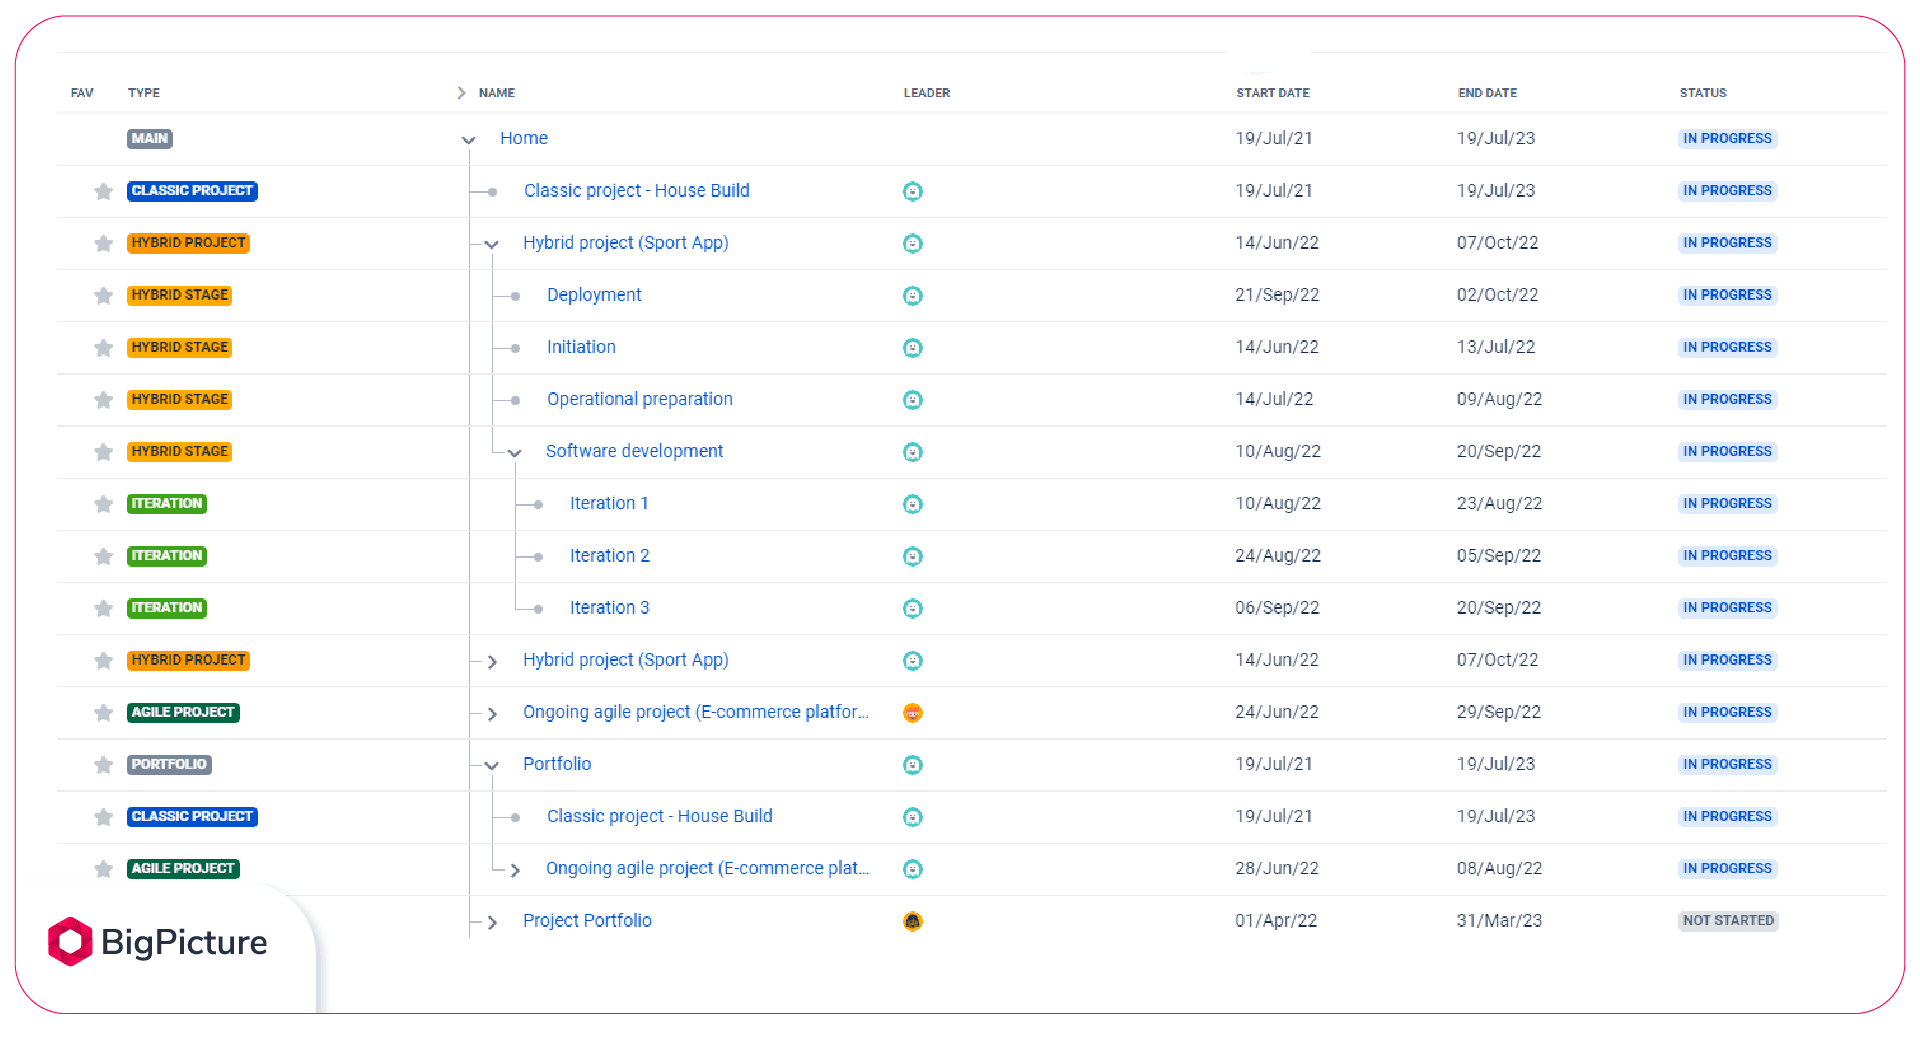
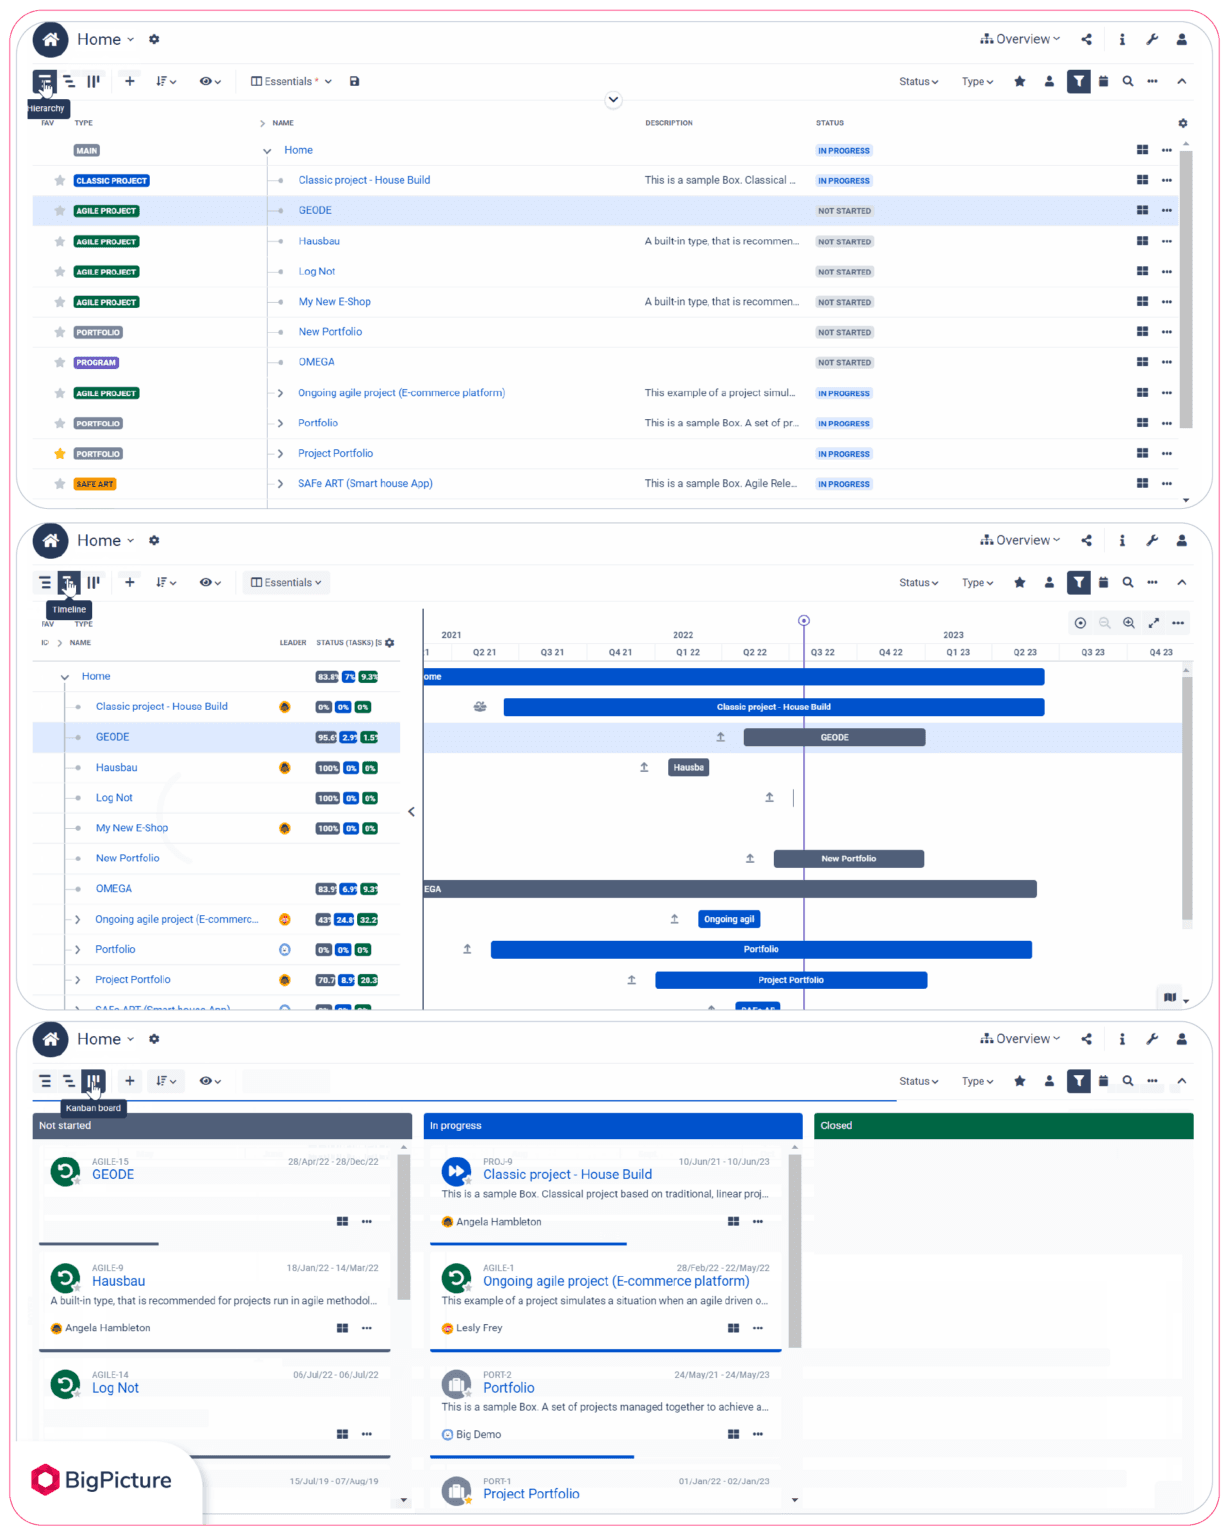
You can view all of your initiatives from a high-level perspective. BigPicture has a special element for that called the Overview module (or the command center).
First, this module lets you look up all active projects and other pieces of work in one place. And second, it is your go-to place for structuring and tracking all of the projects your organization currently runs. The tree-like view you have seen earlier was the Hierarchy view which we structured using the drag and drop feature. With a single click, you can switch it to the Timeline (Gantt chart-like) view and the Kanban board view.
You can consider the Timeline view as a roadmap for all your active projects, which, just like on a Gantt chart, you can move and adjust parents’ and children’s periods. As for the Kanban board view, here, you will see your initiatives as cards distributed across the “Not started,” “In progress,” and “Closed” board columns. Since it is an Agile board, you also can move individual cards between the columns.
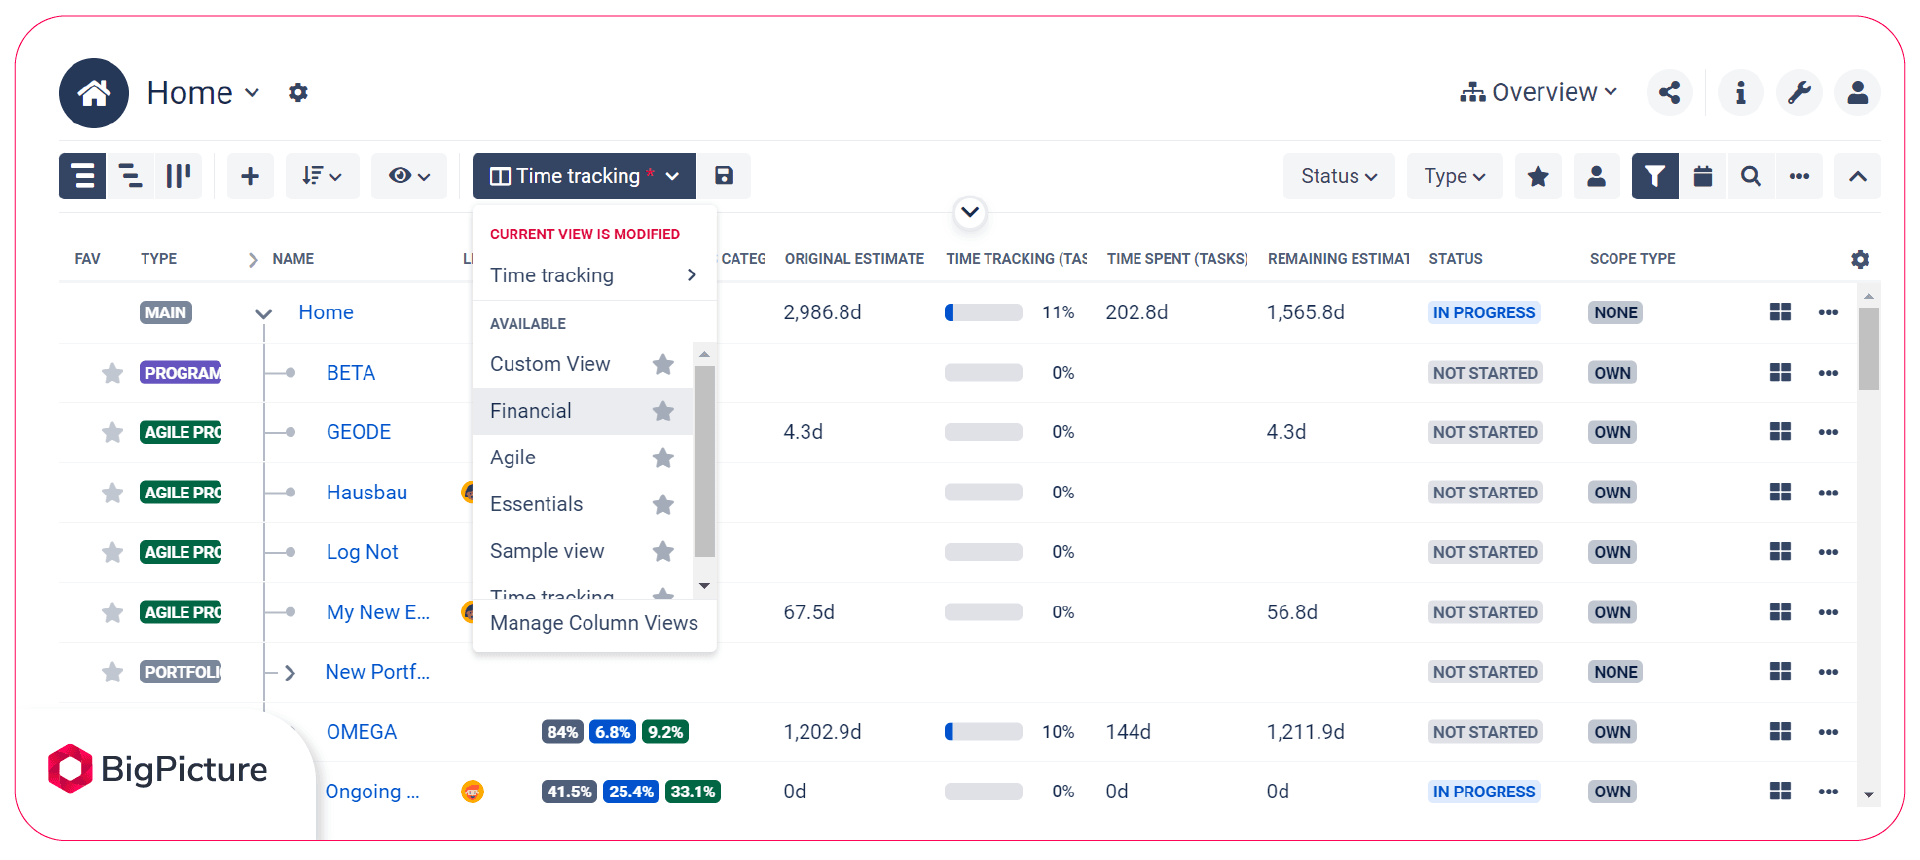
4. Track important data
The Hierarchy view is not set in stone. You can change it by adding new columns (including the custom ones) and setting their aggregations. Each column shows different data so it is up to you what you want to see next to your initiatives. Moreover, you can create several view setups and switch between them depending on what you want to track.
For example, one view could consist of time-tracking columns while the other could focus on the financial aspects of your portfolio.
5. Collaborate with your stakeholders
Managing projects and portfolios is a team effort, so easy collaboration and document sharing are crucial, especially when you manage distributed teams and work with external stakeholders.
Internal stakeholders
If you use a Jira cloud instance in your organization, then you can use a cloud version of BigPicture, too. Thanks to this, everyone who has access to Jira can see what you see and work on the same project in real time. If you work with Gantt charts, your teams can create their own views in the Gantt module the same way as in the Overview module. This way, everyone sees what they need to track.
Agile and hybrid project teams, on the other hand, have an Agile board (Board module) at their disposal where they can follow dependencies, tasks, and Sprints (or increments). Moreover, thanks to role-based security settings, you do not need to worry about your colleagues making unintentional changes to your project or accessing selected app modules.
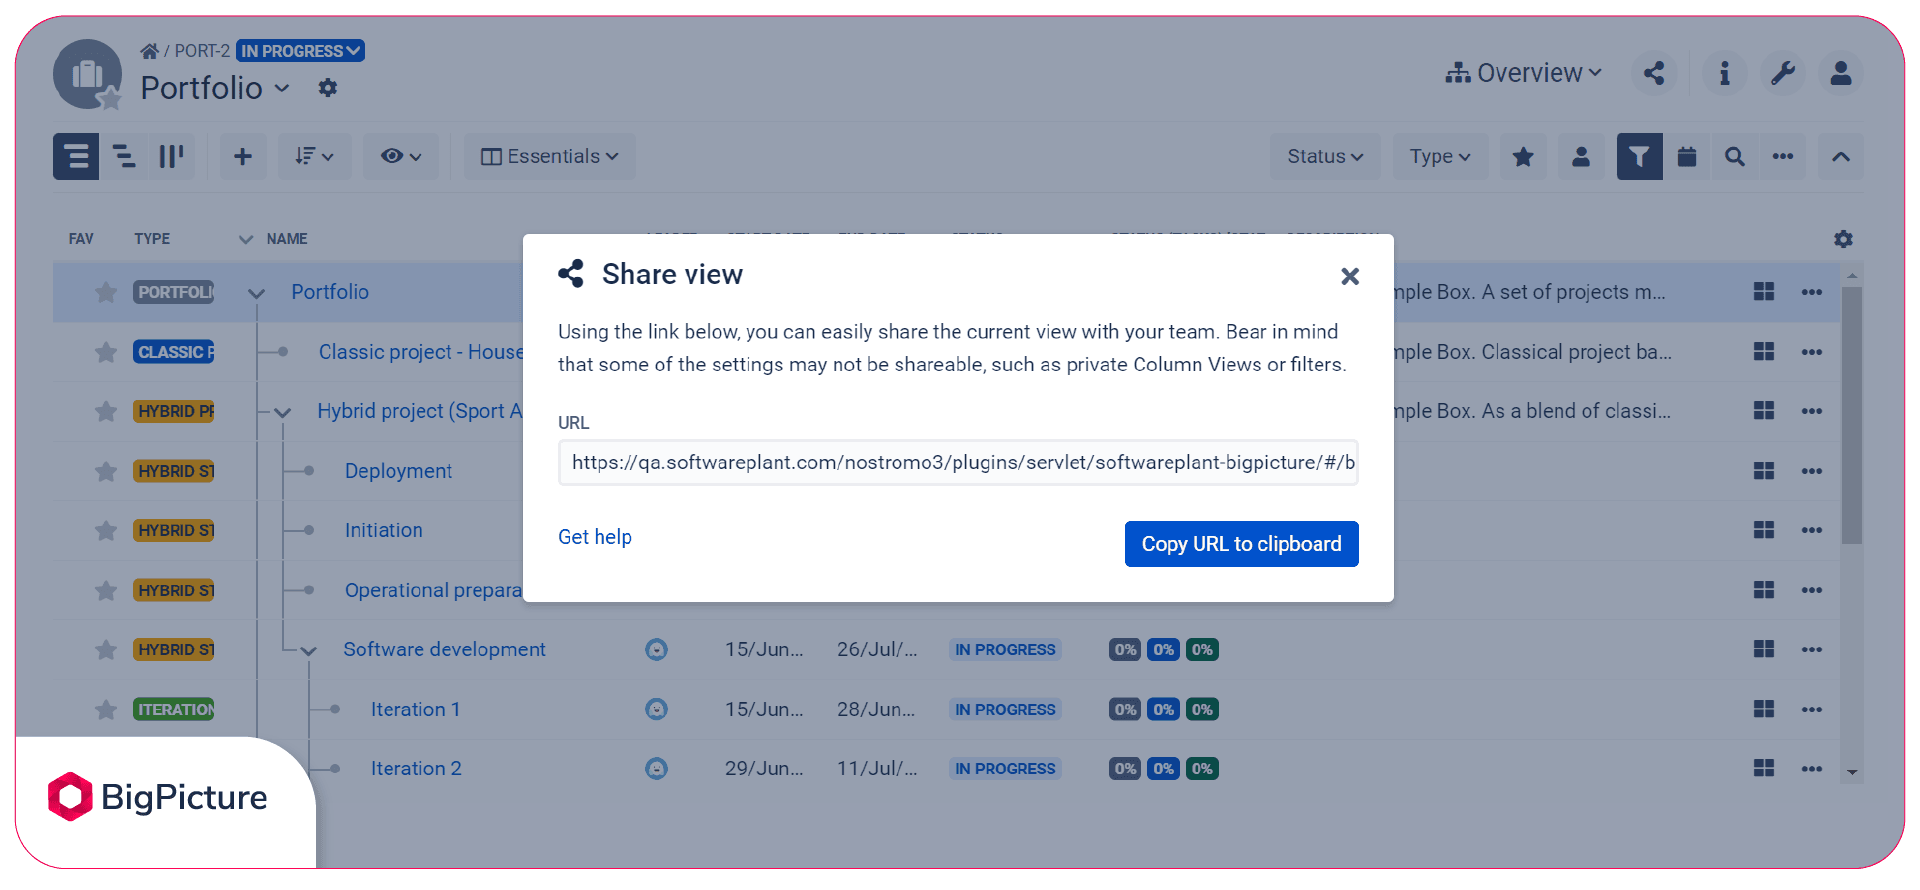
External stakeholders
As for the external stakeholders, you can share your view by sending them a unique link they can click to open your view. If they have Jira, they will be able to open the link and look at the same data as you do.
Other modules, such as Board and Gantt, additionally support the Export manager feature, which allows you to export a given view to one of the available formats (e.g., .pdf or .csv). Alternatively, you can export it with the help of the BigTemplate app.
6. Build cross-project dependencies
Not all of the projects live separate lives and some of them could have an impact on another one. Therefore, you might want to expect your Jira portfolio plugin to support cross-project dependencies. With BigPicture, you will also be able to create impactful dependencies between issues and visualize them on the Gantt chart or Agile board. This way, you will know which project or task depends on another and thus, will be able to keep your portfolio in a good shape.
Please note that even if you already have made some connections between individual portfolio items using Issue Links in Jira, you can map them to dependencies in BigPicture.
7. Balance resources
You cannot have unlimited resources. Therefore, you need to know who goes where to be able to allocate respective team members to the individual projects.
In the BigPicture’s Resources module, you can see the planned effort for teams and individuals working across your portfolio in a color-coded chart. The green, orange, and red colors indicate who has too few, just about, and too many hours assigned to them. You can manage your resources’ holiday plans, workload plans, and skills.
Moreover, if there is an individual whose capacity was exceeded (or could take a few hours more), you can change their allocation or the tasks directly in the app. BigPicture will synchronize these changes with Jira. Also, thanks to the Absences feature, individuals can enter their absences on their own also straight inside the app.
8. Identify and manage portfolio risks
Risks are part of every project, and the richer your portfolio is, the more likely it is for them to occur at some point in time. Organizations that manage portfolio risks proactively are in a better position to take on more risk, improve portfolio value, and have a greater percentage of project delivery success. You can prepare for the portfolio uncertainties by visualizing them on a risk matrix that comes with BigPicture.
The matrix is a two-dimensional table that spans across two axes: risk probability and risk impact. You can have a risk matrix for every project but also create one for your portfolio where you will keep either the issues you assessed to be at risk or separate issues you add to the matrix as risks.
The risk matrix is a very visual tool and allows you to customize it in various ways, including hiding the axis values you want to see, their order, and their names. You move around the risk cards with a drag-and-drop feature, which is an easy way to keep the uncertainties always up to date with regard to their risk rate.
9. Expand and scale
If your organization is growing, then your portfolio plugin for Jira also must be able to expand and scale to meet your increasing number of projects and users. BigPicture is ready for this. Our Jira portfolio plugin supports a variety of project management methodologies, including SAFe®. You can, among many others, plan and execute Program Increments, organize your initiatives specifically for ARTs with dedicated templates, track progress with bar and pie charts, and set goals and objectives.